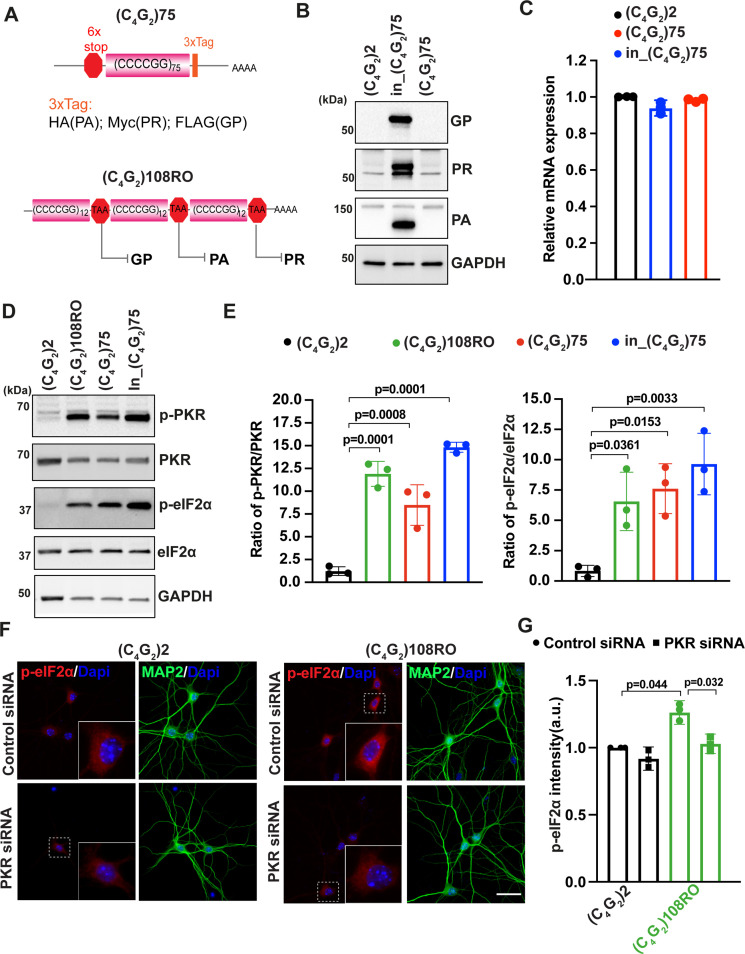
Figure 3. Antisense C4G2 repeat expanded RNAs activate the PKR/eIF2α pathway independent of DPR proteins.
(A) (Top) Schematic illustration of (C4G2)75 repeats without the human intronic sequences. 3× protein tags were included at the C- terminus of the repeats to monitor the DPR proteins in each frame. (Bottom) Schematic illustration of antisense (C4G2)108RO repeats with stop codons inserted in every 12 repeats to prevent the translation of DPR proteins from all reading frames. (B) Immunoblotting of DPR proteins in HEK293T cells expressing in_(C4G2)75, (C4G2)75, or 2 repeats. DPR protein levels were detected using anti-FLAG (frame with GP), anti-MYC (frame with PR), and anti-HA (frame with PA). GAPDH was used as a loading control. (C) mRNA levels were measured by quantitative qPCR in cell expressing in_(C4G2)75, (C4G2)75, or 2 repeats. Error bars represent SD (n = 3). (D, E) Immunoblotting of p-PKR and p-eIF2α in HEK293T cells expressing in_(C4G2)75, (C4G2)75, (C4G2)108RO, or 2 repeats. p-PKR (T446) and p-eIF2α (Ser51) were normalized to total PKR and eIF2α, respectively. GAPDH was used as a loading control. Error bars represent SD (n = 3 independent experiments). Statistical analyses were performed using one-way ANOVA with Tukey’s post hoc test. (F, G) Representative images (F) and quantitation (G) of p-eIF2α in primary neurons expressing antisense (C4G2)108RO or 2 repeats in the presence and absence of PKR siRNA. Scale bars, 10 µm.


