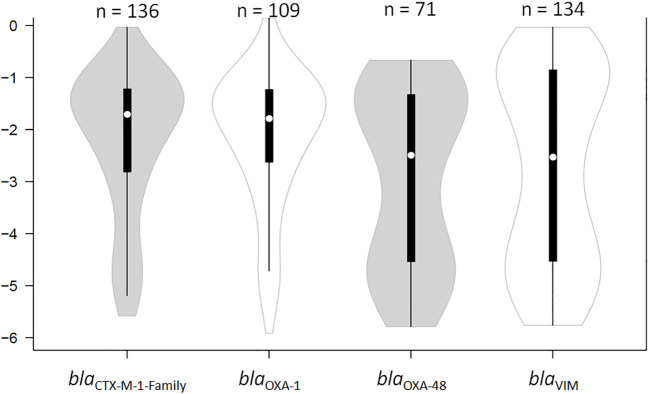
Figure 1.
Violin plot showing the distribution of the relative loads of the samples that were positive by qPCR for bla CTX-M-1-Family, bla OXA-1, bla OXA-48, and bla VIM. The results are expressed in an inverse logarithmic scale where 0 is 100% of the bacterial population, -1 is 10%, -2 is 1%, and so on until -6 which is 0.0001% of the bacterial population, and our detection limit. “n” stands for the number of samples that were positive for the respective gene of antibiotic resistance.

