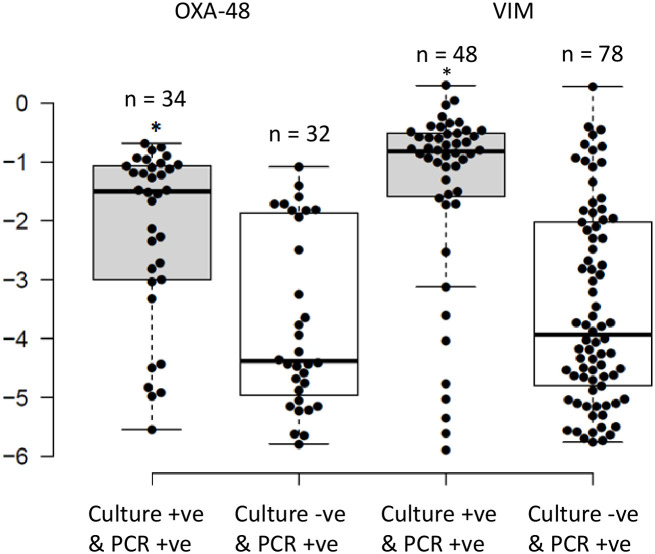
Figure 2.
Distribution of the relative loads of the samples that were positive by routine cultures and PCR for OXA-48 and VIM, compared to those that were only positive by PCR. The results are expressed in an inverse logarithmic scale where 0 is 100% of the bacterial population, -1 is 10%, -2 is 1%, and so on until -6 which is 0.0001% of the bacterial population, and our detection limit. *Implies statistically higher relative intestinal loads for samples that were positive by PCR and routine cultures as opposed to being positive by PCR alone (P<0.05).

