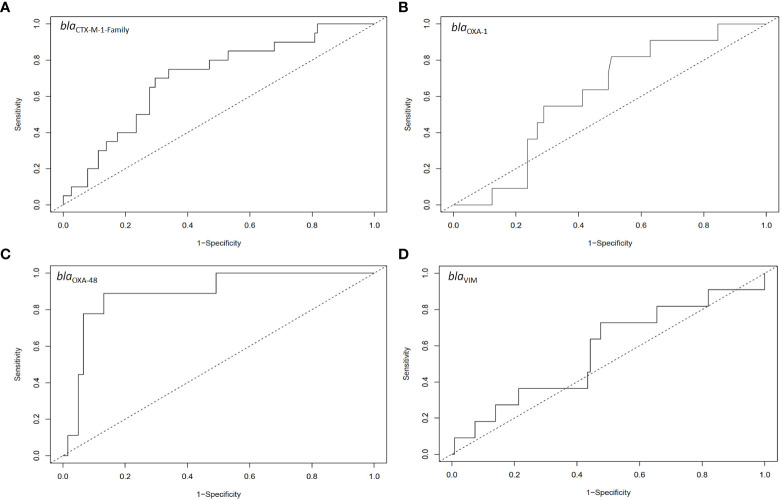
Figure 4.
ROC analysis for the relative intestinal loads of (A) bla CTX-M-1-Family, (B) bla OXA-1, (C) bla OXA-48, and (D) bla VIM for samples that had extra-intestinal isolates harbouring the relative genes as compared to those that did not have extra-intestinal isolates harbouring these genes. The number of samples included in these analyses are the same as those in Figure 3 .

