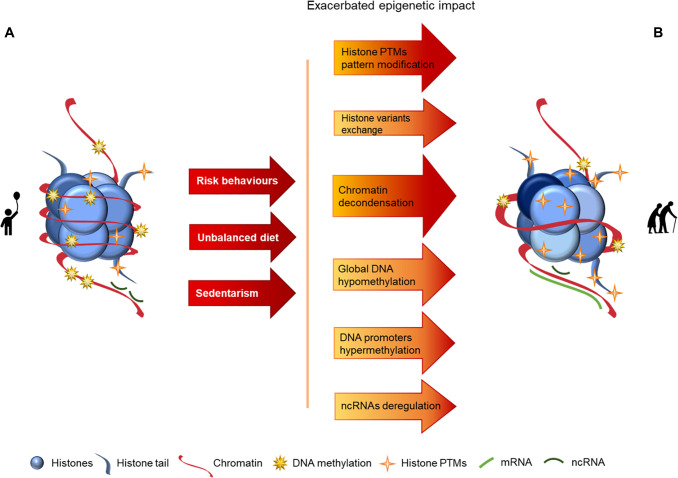
Figure 1.
Representation of age-associated epigenetic changes. (A) Representation of a young individual chromatin: tight chromatin compactation, high levels of DNA methylation, few histone PTMs (particularly acetylation), canonical histones and balanced non-coding RNA regulation; (B) Representation of an old aged individual chromatin, we may observe a looser chromatin structure, lower levels of DNA methylation, higher levels of histones PTMs (particularly acetylation), histone variants presence, chromatin remodeling and disturbances in ncRNA regulation, what is reflected in an overall chromatin instability increase, when compared with the structure presented in A. The transition between the structures presented in A and B is represented by arrows. The arrows in red present the causes (here presented as a lifetime of risk behaviors (namely tobacco and alcohol consumption), unbalanced diet and sedentarism) whose effects are reflected by the arrows in orange/red, where darker colors represent more pronounced epigenetic alterations.

