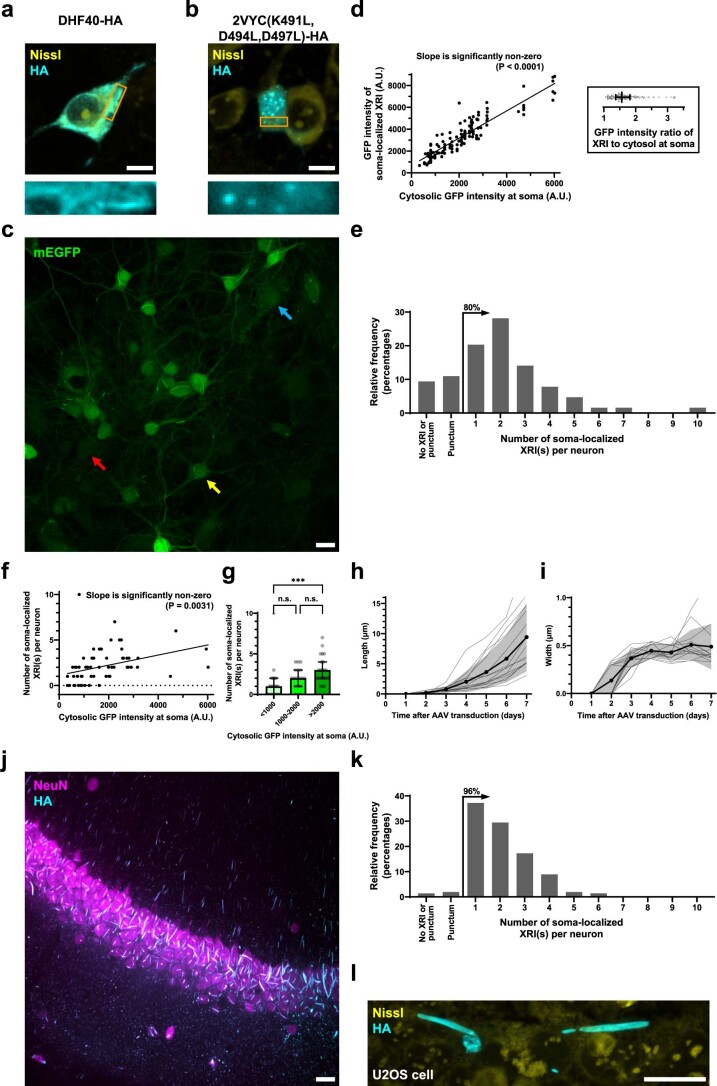
Extended Data Fig. 1. Analysis of XRI formation in neuron cultures and in mouse brains.
(a-b) Representative confocal images of cultured mouse hippocampal neurons expressing (a) DHF40 or (b) 2VYC(K491L,D494L,D497L) with epitope tag HA, taken after fixation, Nissl staining, and immunostaining against the HA tag. Scale bars, 5 µm. Rectangular panels at the bottom, enlarged views of regions marked in orange rectangles in the top row of square panels. See Supplementary Table 1 for sequences of the motifs; see Supplementary Table 2 for all tested constructs. (c) A representative confocal image in the GFP channel of cultured mouse hippocampal neurons 7 days after AAV transduction of AAV9-UBC-mEGFP-P2A-XRI-HA. Bicistronic co-expression of mEGFP with XRI (via P2A) allows estimations of the level of AAV delivery in individual cells using GFP intensity in the cytosol. Colored arrows indicate representative neurons with fiber-like structures (that is, successful formation of XRI assemblies; yellow arrow), punctum-like structures (blue arrow), or no resolvable structure (red arrow). Scale bar, 20 µm. (d) Left, scatter plot of the GFP intensity of soma-localized XRI versus cytosolic GFP intensity (black line, line fit from linear regression; P value, two-sided F test with the null hypothesis that the slope is zero); right, the ratio of the GFP intensity of soma-localized XRI to the cytosolic GFP intensity (middle vertical line, median; error bar, interquartile range; gray dots, individual data points); n = 134 XRIs from 51 neurons with soma-localized XRIs from 4 fields of view from 1 culture. Throughout this figure: cytosolic GFP intensities were measured by averaging the pixel intensity values across pixels within the soma but outside the XRIs, from images captured under the same imaging condition in the GFP channel; XRI GFP intensities were measured by averaging the pixel intensity values along individual XRIs in these images. (e) Histogram of the number of soma-localized XRIs per neuron, among GFP-positive neurons (n = 64 neurons from 4 fields of view from 1 culture), 7 days after AAV transduction of AAV9-UBC-mEGFP-P2A-XRI-HA. ‘80%’ with an arrow, 80% of the neurons had soma-localized XRI(s). (f) Scatter plot of the number of soma-localized XRIs per neuron versus the cytosolic GFP intensity for neurons in e. Black line, line fit from linear regression; P value, two-sided F test with the null hypothesis that the slope is zero. (g) Bar plot of the number of soma-localized XRIs per neuron versus cytosolic GFP intensity for neurons in e. Bar height, median; error bar, interquartile range; gray dots, individual data points. n.s., not significant; ***, P < 0.0001; Kruskal-Wallis analysis of variance followed by post-hoc Dunn’s test. (h-i) Length (h) and width (i) of XRI versus time after AAV transduction (n = 14 XRIs from 8 neurons from 1 culture; length and width were normalized to the maximum values over time, respectively). Thick centerline, mean; shaded boundary, standard deviation; thin lines, data from individual XRIs. (j) A representative maximum intensity projection confocal image of CA1 neurons in the AAV-injected region of mice injected with AAV9-UBC-XRI-HA at CA1, allowed for expression for 14 days, and then fixed, sliced, and stained against NeuN for soma of neurons and against HA for XRI. Scale bar, 20 µm. (k) Histogram of the number of soma-localized XRIs per neuron in the field of view described in j, among NeuN-positive cells (n = 516 neurons from 1 field of view from 1 mouse). ‘96%’ with an arrow, 96% of the neurons had soma-localized XRI(s). (l) A representative confocal image of U2OS cells expressing XRI-HA for 4 days, taken after fixation, Nissl staining, and immunostaining against HA for XRI. Scale bar, 20 µm. See Supplementary Table 3 for details of statistical analysis.

