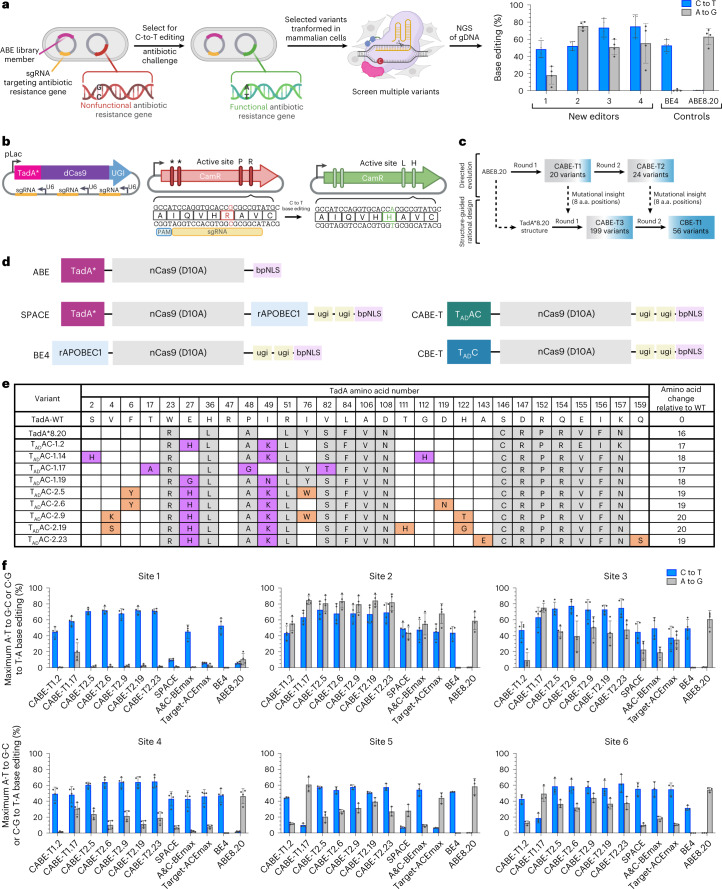
Fig. 1. Directed evolution of CABE-T1 and CABE-T2.
a, Schematic overview of directed evolution workflow to identify TadA variants capable of C-to-U deamination. b, Schematic representation of expression and selection plasmids used in directed evolution campaigns. Left: base editor expression plasmid encoding library member and sgRNA, right: selection plasmid encoding a nonfunctional antibiotic resistance gene. Reversion at targeted sites restores gene function. c, Overview of CBE-T editor development through directed evolution and protein engineering. d, Schematic representation of select base editor architectures. ABE12 contains a laboratory-evolved TadA* deaminase, nCas9 (D10A) and a nuclear localization tag (bpNLS). Dual editor (for example, SPACE16) is comprised of an evolved TadA* deaminase, nCas9 (D10A), cytidine deaminase rAPOBEC1 along with two units of UGI and a bpNLS tag. CBEs (for example, BE4 (ref. 3)) are comprised of a naturally occurring cytidine deaminase (for example, rAPOBEC1), nCas9 D10A, two units of UGI and a bpNLS tag. CABE-Ts, reported here, are comprised of a TadA variant capable of A-to-G and C-to-T editing (TADAC), nCas9 (D10A), two units of UGI and a bpNLS tag. CBE-Ts, reported here, are comprised of a TadA variant capable of C-to-T editing (TADC), nCas9 (D10A), two units of UGI and a bpNLS tag. e, Substitutions incorporated into TadA in selected CABE-T editors from directed evolution round 1 (CABE-T1) and round 2 (CABE-T2). Substitutions incorporated in TadA*8.20 related to wild-type (WT) TadA are highlighted in gray, and those identified in directed evolution round 1 and 2 are highlighted in violet and orange, respectively. Values in the last column represent the number of substitutions added to each variant compared to WT TadA. f, Maximum C·G to T·A and A·T to G·C conversion in HEK293T cells transfected with human expression plasmids encoding CABE-T1 and CABE-T2 editors or controls. Values and error bars reflect the mean and s.d. of n = 3 (sites 1–4) or 4 (sites 5 and 6) independent biological replicates performed on different days.

