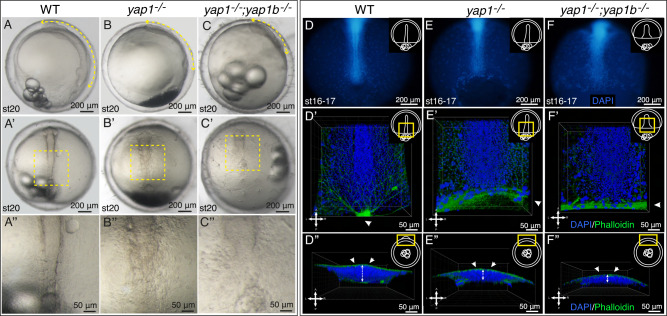
Fig. 1. Analysis of axis assembly in yap mutants.
A–C Brightfield images of WT, yap1−/− and yap1−/−;yap1b−/− embryos at stage 20 (post gastrulation stage) A–C. Yellow double-headed arrows highlight the shortening and the widening of the A-P axis A–C. A”–C” correspond to the magnifications indicated with a yellow square in their corresponding A’–C’ images. D–F DAPI staining, in which nuclei are labeled in blue, was performed in WT, yap1−/− and yap1−/−;yap1b−/− embryos fixed at stage 16–17 (late gastrula) (D–F). Whole embryos are shown under the fluorescent stereo microscope. DAPI and Phalloidin immunostained confocal images show the posterior axis of WT, yap1−/− and yap1−/−;yap1b−/− embryos at stage 16, 17 (nuclei in blue and filamentous actin in green) (D’, E’, and F’). XZ projections of the DAPI and Phalloidin immunostaining, showing the D–V height of the axis of WT, yap1−/− and yap1−/−;yap1b−/− embryos (D”, E” and F”) Embryos’ orientations are indicated with a cross (A: anterior, L: left, R: right, P: posterior). Yellow rectangles in schematic embryo representations indicate the area depicted in each image. Scales bars are 200 µm (A–C, A’–C’ and D–F) and 50 µm (A”–C”, D’–F’ and D”–F”).

