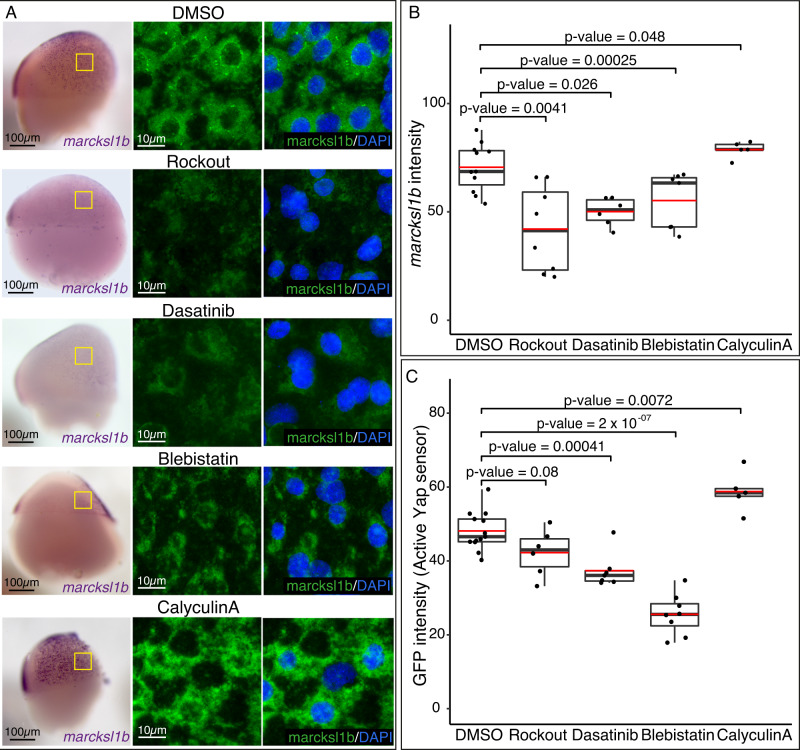
Fig. 8. Yap activity response to intracellular tension alterations.
A ISH analysis distribution of marcksl1b in WT embryos treated with DMSO, Rockout, Dasatinib, Blebistatin, or CalyculinA for 2 h. Lateral stereo microscope images of stage 16 embryos are shown (first row). Confocal microscopy images of marcksl1b fluorescent ISH stained with DAPI (second and third rows) from the areas indicated with yellow rectangles are shown. B Quantification of marcksl1b fluorescent ISH signal in DMSO, Rockout, Dasatinib, Blebistatin, or CalyculinA treated embryos. P values are indicated in the figure. n = 11 DMSO treated embryos, n = 8 Rockout-treated embryos, n = 6 Dasatinib-treated embryos, n = 7 Blebistatin treated embryos, n = 5 CalyculinA treated embryos. C Quantification of GFP signal intensity in DMSO, Rockout, Dasatinib, Blebistatin, or CalyculinA treated transgenic embryos for the Tead/Yap sensor GTIIC::GFP. P values are indicated in the figure. n = 13 DMSO treated embryos, n = 6 Rockout-treated embryos, n = 7 Dasatinib-treated embryos, n = 8 Blebistatin treted embryos, n = 5 CalyculinA treated embryos. Boxes represent the quartiles; the whiskers indicate the maximum and minimum values. Red and black lines indicate the median and the mean, respectively. Points indicate independent embryos. Two-sided Student’s t tests were performed to evaluate statistical significance. Scale bars = 100 µm and 10 µm (A). Source data are provided as a Source Data file.

