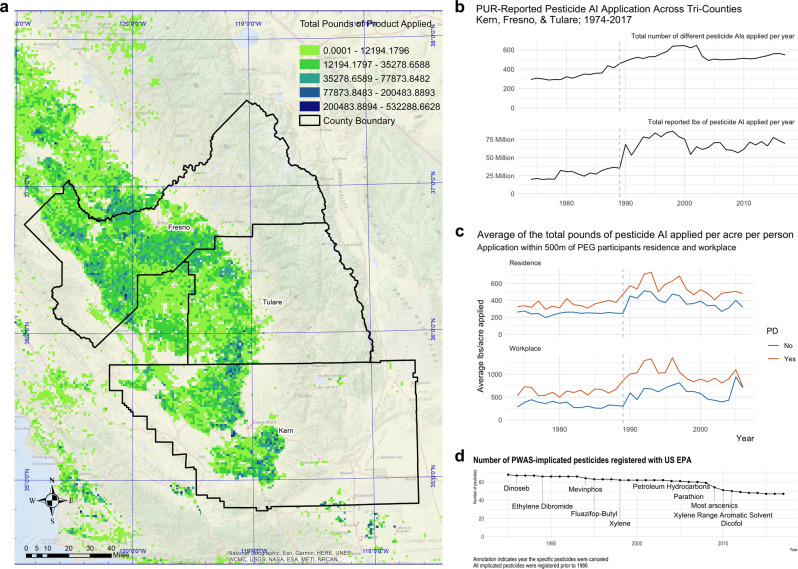
Fig. 1. Description of agricultural pesticide use in the study area, including geography of applications, number of unique active ingredients applied by year, total pounds applied, and pesticide registration timeline.
a Geography of study region for PEG cohort and total pounds of pesticides applied in the region in 2000. Total pounds of pesticides applied shown by color scale. b The number of different PUR-reported pesticides applied per year across the three counties and the total reported pounds of pesticide applied per year across the three counties (1974–2017). c The average total reported pounds of pesticide applied per acre around PEG participants’ residential and workplace addresses per year from 1974–2006 (the mean index year), by PD status. Values above the 99th percentile were limited to the 99th percentile. d Timeline showing the number of PWAS-implicated pesticides that were registered with the US EPA by year. The annotation indicates the year the named pesticide had registration canceled or withdrawn. Source data are provided as a Source Data file.

