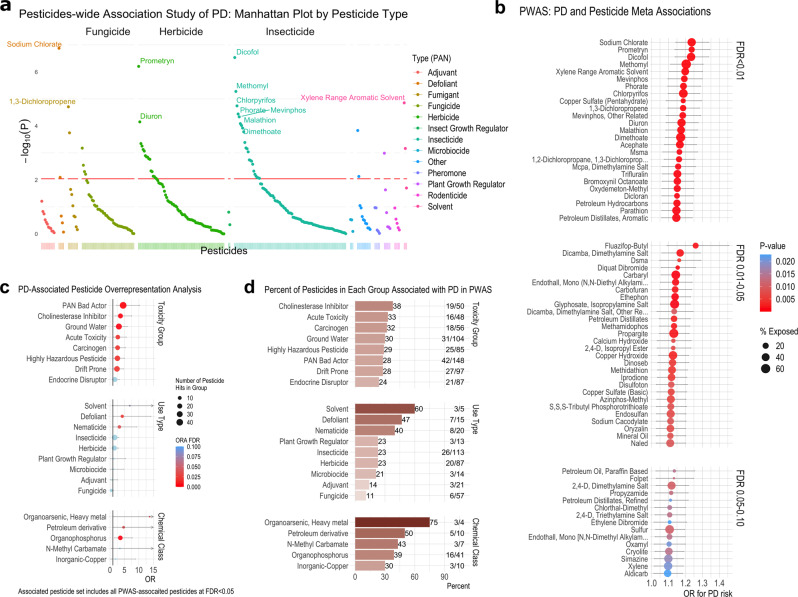
Fig. 2. Pesticide-Wide Association Study analysis associated specific pesticides with PD and overrepresentation analysis implicates groups of pesticides overrepresented in the associated pesticides.
a Manhattan plot detailing the -log(p-value) from the meta-analysis for all 288 pesticides tested for association with PD. We conducted univariate, unconditional logistic regression to calculate odds ratios (ORs) and 95% confidence intervals (CIs) for PD with each pesticide (n = 288). We combined the OR estimates from each study wave and location (residential and occupational addresses) in a fixed effects meta-analysis, results shown here. P-values were based on a z-score statistic and two-sided interval. P-values were adjusted for multiple testing using an FDR and are shown in Supplementary Data 3. The red horizontal line indicates the FDR = 0.05 cut-off. b Dot plot displaying the odds ratio (OR; dot) and 95% CI (error bars) from the meta-analysis described above for all pesticides with an FDR < 0.10. Analysis for Figs. 2a and 2b was based on n = 829 PD patients and n = 824 controls. The log odds ratio is the center of the 95% CI on the logarithmic scale. The log odds ratio and 95% CI on the logarithmic scale were exponentiated to get the odds ratio and 95% CI. c Results of overrepresentation analysis to test for overrepresentation of pesticide groups (toxicity groups, chemical classes, and use types) in the set of PWAS PD-associated pesticides relative to all pesticides we assessed. Odds ratios (dot) and 95% CIs (error bars) are displayed. The log odds ratio is the center of the 95% CI on the logarithmic scale. The log odds ratio and 95% CI on the logarithmic scale were exponentiated to get the odds ratio. Given the asymmetrical nature of the resulting odds ratio, the odds ratio is no longer the center of the 95% CI. The overrepresentation analysis was based on n = 286 pesticide associations. The associated pesticide set includes all associated pesticides at FDR < 0.05 (n = 53 pesticides). d Bar graph indicating the percent of pesticides in each group associated with PD in the PWAS. The graph also shows the total number of pesticides tested in the PWAS from each group (denominator) and the number of pesticides in each group associated with PD (numerator) on the right. This information is used for the overrepresentation analysis. For example, there were 50 cholinesterase inhibitor pesticides assessed for association with PD, 17% of all tested pesticides (50/286). In total, 19 cholinesterase inhibitors were associated with PD at FDR < 0.05 in the PWAS (19/50, 38%). Using an odds ratio and Fisher’s exact test, we found that the odds of being among the PD-associated pesticides was 3.6-fold higher for the cholinesterase inhibitors versus the non-cholinesterase inhibiting pesticides (OR = 3.62, 95% CI = 1.73. 7.50, FDR = 3.2e-03). Source data are provided as a Source Data file.

