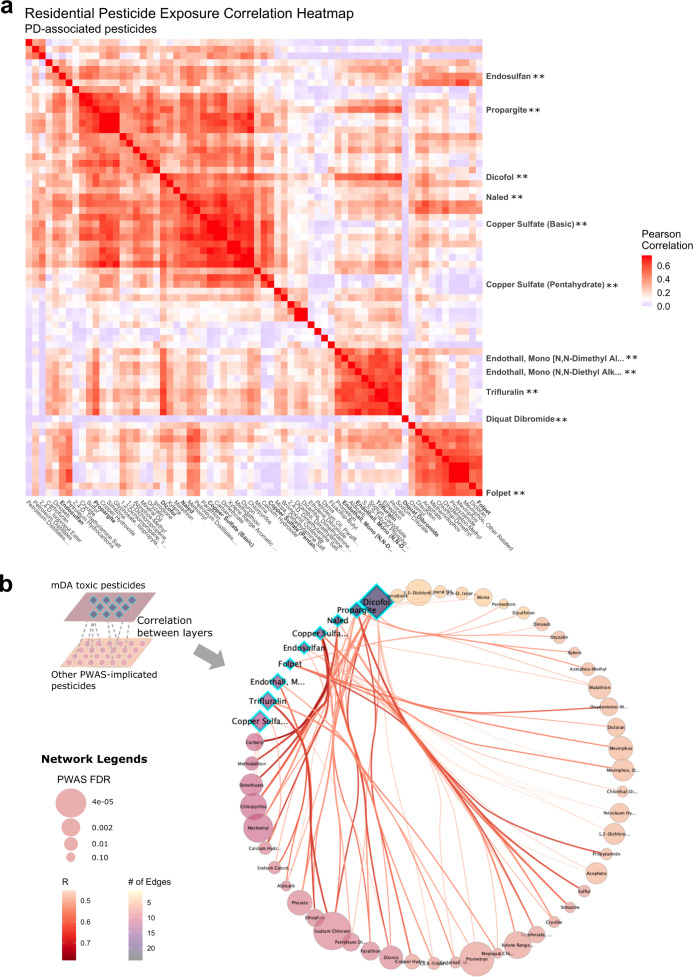
Fig. 5. Pesticide exposure correlations demonstrate substantial interconnections of pesticides that produced significant mDA neuron death with many other pesticides.
a Correlation heatmap indicating the pairwise Pearson correlation coefficient for 68 PWAS-implicated pesticides (FDR < 0.10), using residential address-based exposures. The pesticides which produced significant mDA neuron death in the iPSC-model are highlighted on the y-axis. No pesticides were significantly negatively correlated. Thus, the blue color represents null (R = 0) correlation to dark red representing strong correlation (R > 0.75). All pesticide labels are shown on the x-axis, the y-axis only displays labels of select pesticides, with the ** indicating that the pesticides were toxic to mDA neurons. b Correlation wheel showing the pesticide exposure correlations across two layers: first, the set of mDA toxic pesticides, which are designated as teal highlighted diamonds, and second, the set of all other PWAS-implicated pesticides, shown as circles. Correlations between layers at R > 0.45 are shown in the circle, correlations within layers are not shown. The size of the shapes in the correlation circle (diamonds and circles) were determined by the PWAS FDR, thus pesticides that were more strongly associated with PD in the PWAS are represented by larger sized shapes. The color of the shapes reflects the density of the connections (i.e. correlations at R > 0.45) made by that specific pesticide with others. Pesticides with a darker color are correlated with more pesticides, and arrangement around the circle is ordered from those with the most correlations (dicofol, darkest color) to the least (petroleum hydrocarbons, lightest color). Dicofol, for example, resulted in significant mDA cell death in the iPSC-model and is therefore shown as a teal highlighted diamond. It was also both (1) the most statistically significant mDA toxic pesticide in the PD PWAS (FDR = 4.2e-05) and therefore shown as the largest diamond, and (2) correlated above R > 0.45 with the most other PWAS-implicated pesticides (n = 24 pesticides), and therefore shown as the darkest color. Note, pesticides that did not correlate across layer at R > 0.45 are not shown on the wheel. Diquat dibromide, for example, was mDA toxic, however, the strongest correlation diquat displays with another pesticides was R = 0.14. Source data are provided as a Source Data file.

