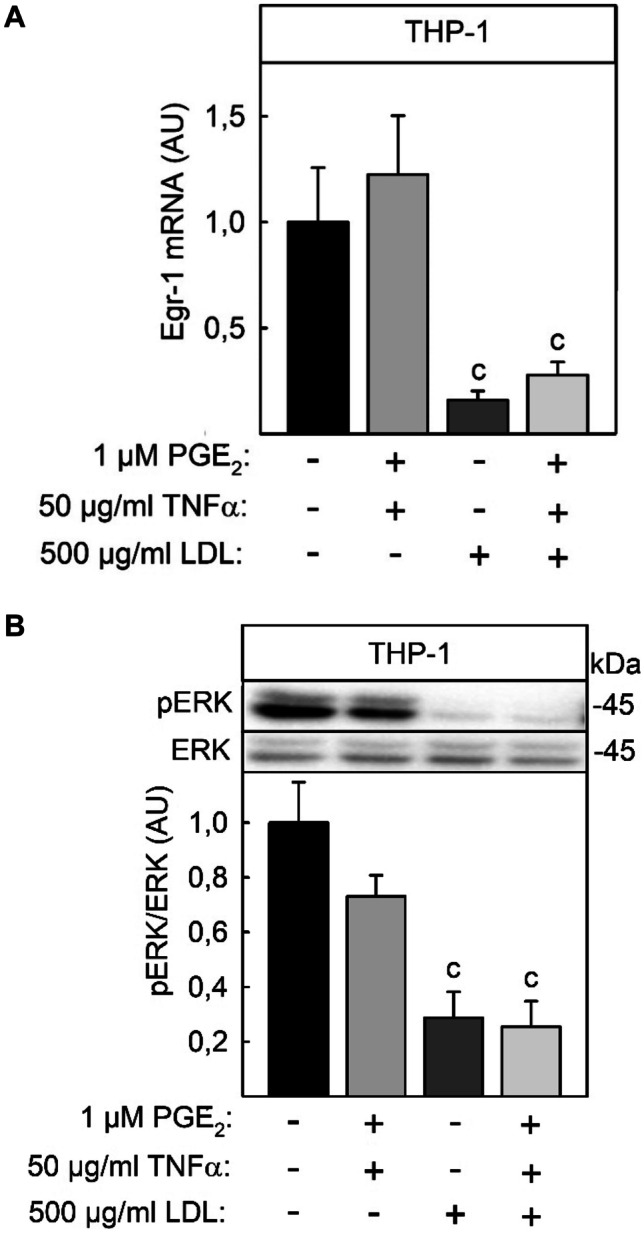
Fig. 7.

LDL-repressed Egr-1 expression and reduction of ERK kinase phosphorylation in THP-1 macrophages. THP-1 macrophages were stimulated with 50 ng/ml TNFα + 1 µM PGE2 in the presence or absence of 500 µg/ml native LDL for the times indicated. A Phosphorylated and total ERK kinase were determined by Western blot as described in the legend of Fig. 7. B Egr-1 mRNA content was measured as described in the legend of Fig. 1. Data shown are means ± SEM of at least five independent experiments performed in triplicate. Statistics: two-way ANOVA with Tukey’s multicomparison test: c, significant lower than without LDL, p < 0.05.
