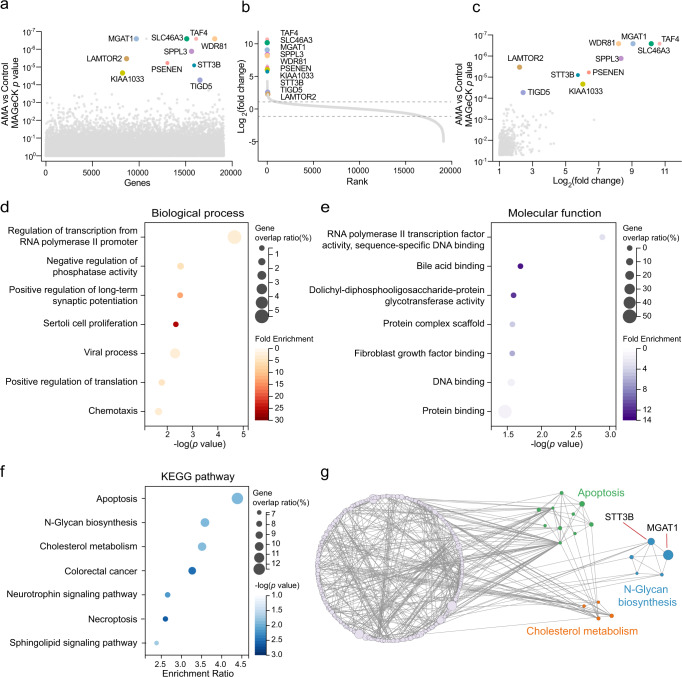
Fig. 2. The CRISPR screen identifies genes and pathways required for AMA toxicity.
a Bubble plot of p value from AMA screen. b Distribution of Log2 fold change (LFC, AMA treatment versus control) for each gene. c The p value and LFC of significant 559 genes. The top 10 genes were highlighted and marked. d, e GO terms enrichment analysis of these significant hits for biological process d and molecular function e. f KEGG pathway analysis of these significant hits. g Genetic interaction network of the significant 559 genes. The node size represents the -Lg (RRA score). Source data are provided as a Source Data file.

