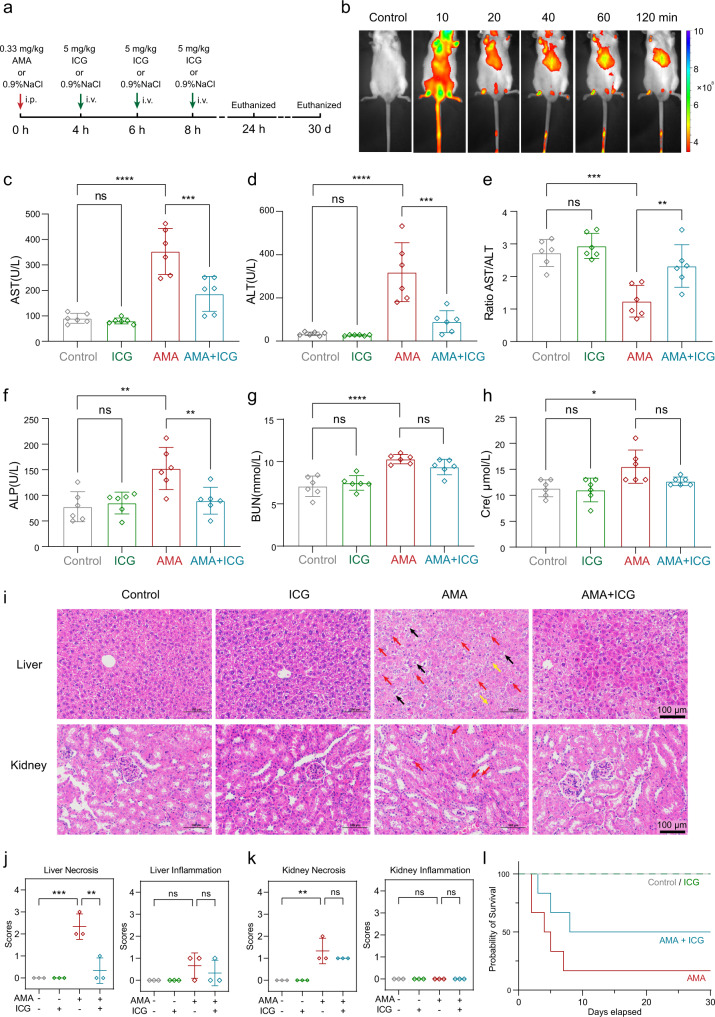
Fig. 7. ICG is an effective antidote for AMA toxicity in mice.
a The scheme of the mouse study. AMA was i.p. injection at 0.33 mg/kg and ICG intravenously injected at 4 h, 6 h and 8 h with a dose of 5 mg/kg. The mice were euthanized at 24 h and 30th day. b NIR fluorescence images of mice at different time points after intravenous injection of ICG. c–h Plasma levels of AST, ALT, the ratio of AST/ALT, ALP, BUN, Cre in different groups (n = 6 biological replicates). c nsp = 0.9889, ****p < 0.0001, ***p = 0.0004; d nsp = 0.9986, ****p < 0.0001, ***p = 0.0001; e nsp = 0.8764, ***p = 0.0002, **p = 0.0060; f nsp = 0.9748, ***p = 0.0020, **p = 0.0091; g nsp = 0.8776, ****p < 0.0001, nsp = 0.3169; h nsp = 0.8776, *p = 0.0163, nsp = 0.3169. i H&E staining of liver and kidney of mice in different treatments. Cellular edema (black arrow), inflammatory cells (yellow arrow), and necrosis (red arrow) were shown. Scale bars are 100 μm. j, k Pathological score of liver and kidney in different treatments (n = 3 biological replicates). j ***p = 0.0005, **p = 0.0015; nsp = 0.2641, nsp = 0.7538; k **p = 0.0021, nsp = 0.5252; the samples all have a standard error of zero. l Survival curves of mice with different treatments (n = 6 biological replicates). Data are presented as mean ± SD. The statistics were assessed using one-way ANOVA followed by Tukey’s multiple comparisons test. Source data are provided as a Source Data file.

