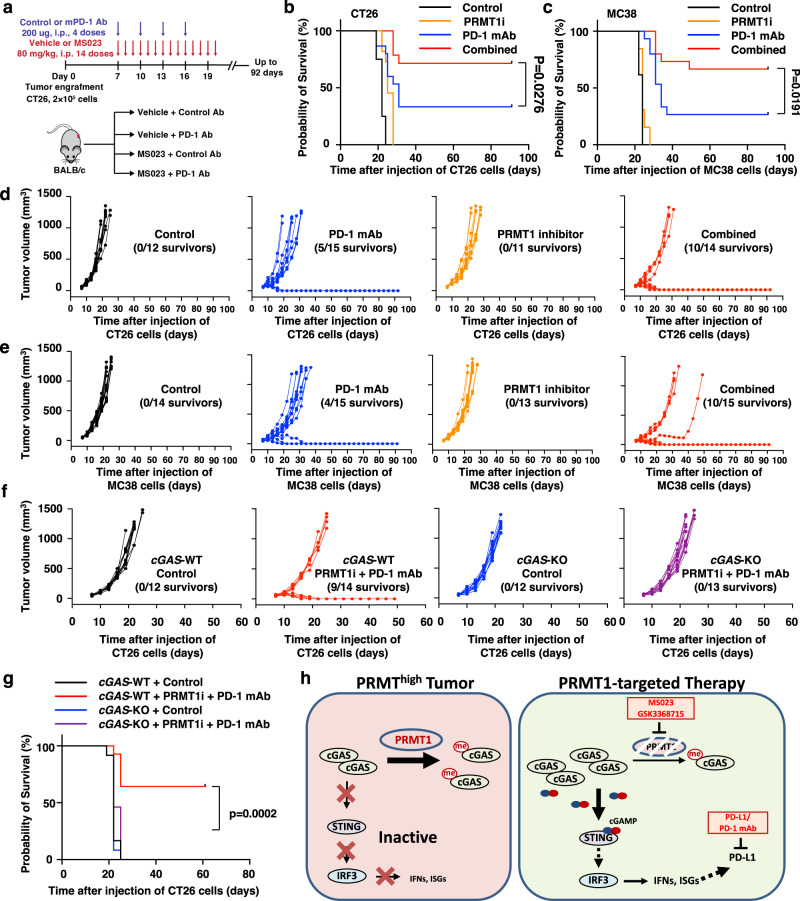
Fig. 7. PRMT1 inhibition boosts the efficacy of anti-PD-1 immunotherapy in vivo in a cGAS-dependent manner.
a A schematic diagram illustrates the animal experiment design for the CT26 syngeneic tumor model with PRMT1 inhibitor and anti-PD-1 antibody treatment. b Kaplan–Meier survival curves for each treatment group in CT26 syngeneic tumor model (Control, n = 12; PD-1 monoclonal antibodies (mAb), n = 15; MS023, n = 11; Combined, n = 14). Two-sided Gehan-Breslow-Wilcoxon test. c Kaplan–Meier survival curves for each treatment group in MC38 syngeneic tumor model (Control, n = 14; PD-1 mAb, n = 15; MS023, n = 13; Combined, n = 15). Two-sided Gehan-Breslow-Wilcoxon test. d Volumes of CT26 syngeneic tumors treated with vehicle + control antibodies (black lines, n = 12), or vehicle + anti-PD-1 mAb (blue lines, n = 15), or PRMT1 inhibitor MS023+ control antibodies (orange lines, n = 11), or combined therapy (red lines, n = 14) were plotted individually. e Volumes of the MC38 syngeneic tumors treated with vehicle + control antibodies (black lines, n = 14), vehicle + anti-PD-1 mAb (blue lines, n = 15), PRMT1 inhibitor MS023 + control antibodies (orange lines, n = 13) or combined therapy (red lines, n = 15) were plotted individually. f Volumes of CT26-cGAS-WT and cGAS-KO syngeneic tumors treated with vehicle + control antibody or MS023 + anti-PD-1 mAb were plotted individually. cGAS-WT + vehicle and control antibody, n = 12, black lines; cGAS-WT + MS023 and anti-PD-1 mAb, n = 14, red lines; cGAS-KO + vehicle and control antibody, n = 12, blue lines; cGAS-KO + MS023 and anti-PD-1 mAb, n = 13, purple lines. g Kaplan–Meier survival curves for each treatment group in CT26-cGAS-WT and cGAS-KO syngeneic tumor model (cGAS-WT + vehicle and control antibody, n = 12; cGAS-WT + MS023 and anti-PD-1 mAb, n = 14; cGAS-KO + vehicle and control antibody, n = 12; cGAS-KO + MS023 and anti-PD-1 mAb, n = 13). Two-sided Gehan-Breslow-Wilcoxon test. h A schematic diagram shows that PRMT1 represses cGAS/STING signaling to promote tumor immune evading, while the combination therapy of PRMT1i and ICB boosts the immune response to promote tumor regression. The animal experiments in a–g were replicated twice, and the representative data were presented. Source data are provided as a Source Data file.

