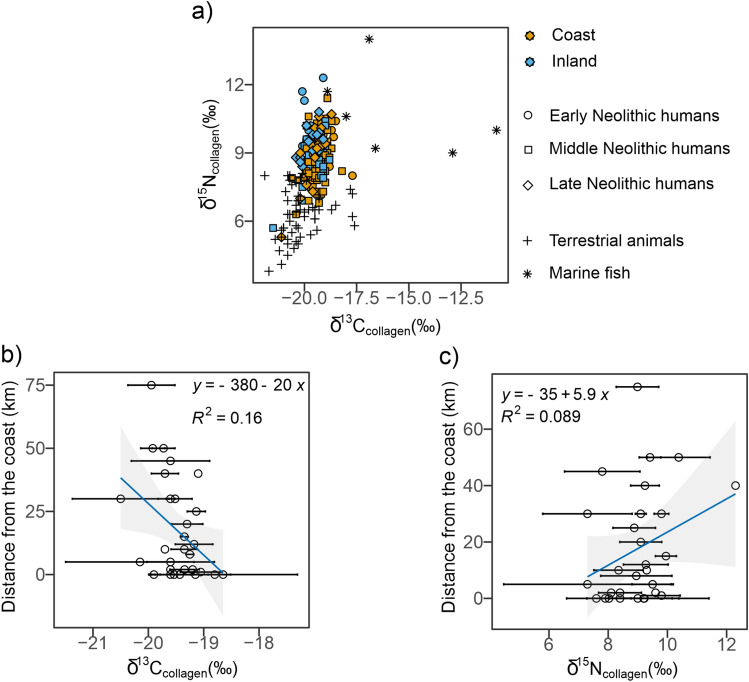
Figure 5.
Scatterplot of δ13C (‰) and δ15N (‰) values of Early (circle), Middle (square) and Late (diamond) individuals also differentiating between coastal (orange) and inland (light blue) sites; terrestrial animals from this study and the literature8,45 are also plotted (crosses) as well as marine fish from the Adriatic8 (a). Correlation between δ13C (‰) and δ15N (‰) and distance to the coast (km) is explored in (b) and (c), respectively. The grey bands represent the 95% confidence interval bands. Data plotted comes from this study and from1,8,44,45.

