
Figure 3.
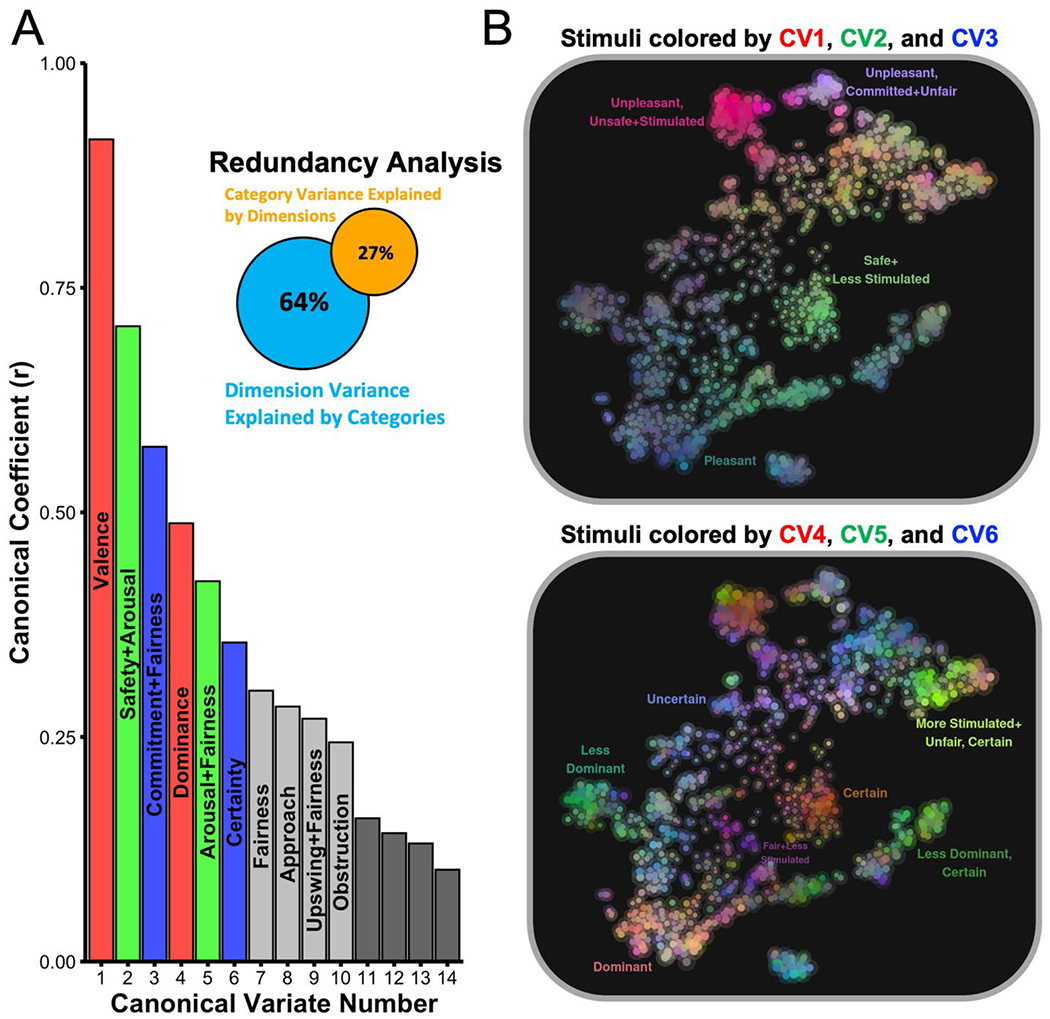
(A) Canonical correlations between the categorical and dimensional ratings and (B) distribution of the first six canonical variate loadings.
Note. (A) Ten canonical variates exhibited significant correlations, suggesting that these latent factors unify variance in affective meaning among the two datasets. Bars are labeled according to the primary dimension(s) associated with each canonical variate (for those that were significant). Colors correspond to the red, blue, green (RGB) color channel assignment in the chromatic maps to the right. (B) The same t-SNE plot from Figure 2 was plotted such that the color of each stimulus (RGB) corresponds to the loading of that stimulus onto each of three canonical variates. The top chromatic map bases the coloring on the first three canonical variates, while the bottom chromatic map bases the coloring on the next three canonical variates. Interactive maps are available at https://labarlab.shinyapps.io/scenarios/.