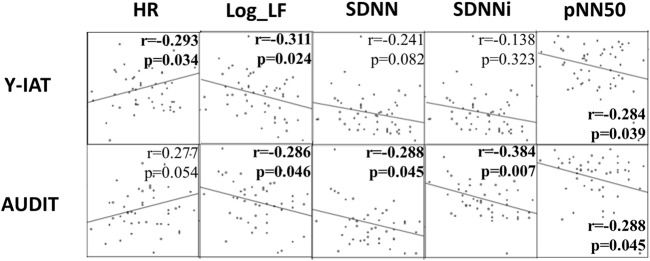
FIGURE 3.
Correlational analysis: Y-IAT and AUDIT with HRV indices. The correlation coefficient and p-value are specified in each plot. Y-IAT, Young’s Internet Addiction Test; AUDIT, Alcohol Use Disorder Identification Test; HR, Mean heart rate; Log_LF, Logarthmically transformed value of low-frequency band; SDNN, The standard deviation of normal-to-normal [R-R] intervals; SDNNi, SDNN index, the average of SDNN for each segment of 50 s length; pNN50, The percentage of successive R−R intervals differing.

