Figure 3.

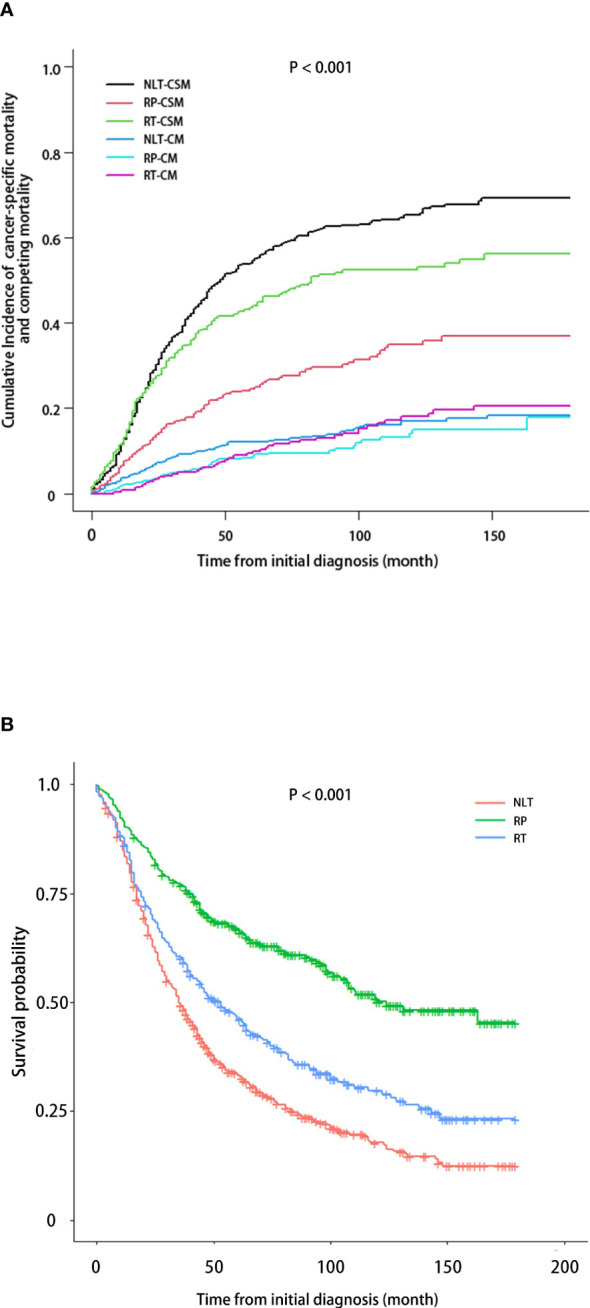
CSM and OS in patients with mPCa based on treatment received. (A) Cumulative incidence of CSM, accounting for the competing risk of non-PCa. (B) Kaplan-Meier analysis demonstrating OS.

CSM and OS in patients with mPCa based on treatment received. (A) Cumulative incidence of CSM, accounting for the competing risk of non-PCa. (B) Kaplan-Meier analysis demonstrating OS.