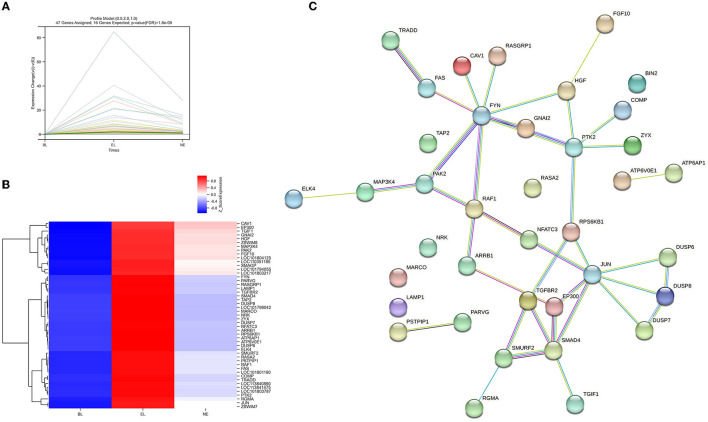
Figure 9.
Genes of profile NO.14 of Gaoyou ducks' ovaries at different physiological stages. (A) 47 genes expression profile of NO.14, the horizontal axis represents different physiological stages of Gaoyou duck's ovary, and the vertical axis shows the time series of gene expression levels for the gene after normalized transformation. (B) Heat map showing the differential gene expression of profile NO.14. “blue” represents low relative expression level, and “red” represents high relative expression level. Each column and row represent a sample, and a gene respectively. (C) PPI network of 47 genes based on the STRING database.

