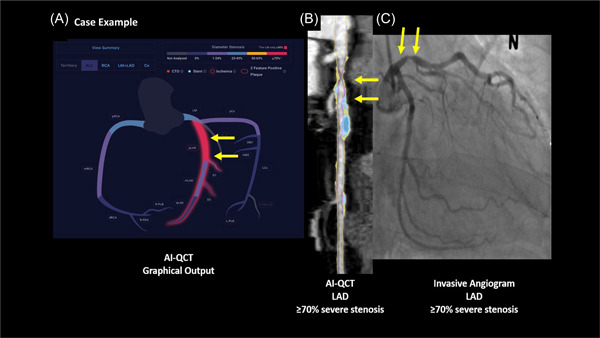
Figure 1.

Example of a patient with AI‐QCT analysis demonstrating severe obstructive (>70%) luminal stenosis in the proximal LAD with invasive cath correlation. AI‐QCT total plaque volume, calcified and noncalcified plaque is also shown. AI‐QCT, atherosclerosis imaging and quantitative cardiac computed tomography; LAD, left anterior descending.
