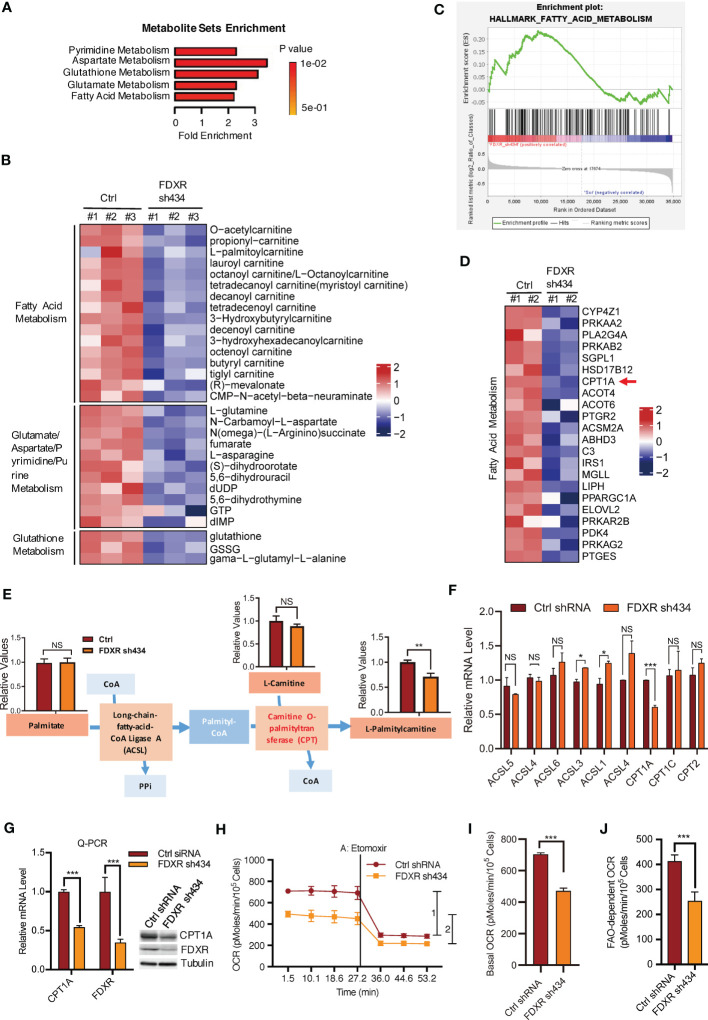
Figure 1.
The effect of FDXR on metabolic pathways in ER+ breast cancer cells. (A) Metabolite sets enrichment analysis of targeted metabolomics assays in T47D cells infected with lentivirus encoding Ctrl shRNA and FDXR sh434. (B) Heatmaps showing the metabolites involved in the indicated metabolic pathways positively regulated by FDXR. (C) Gene set enrichment analysis (GSEA) of gene expression profile in T47D cells infected with lentivirus encoding Ctrl shRNA and FDXR sh434. (D) Heatmaps showing genes related to fatty acid metabolism positively regulated by FDXR. (E) The diagram for FDXR regulation on fatty acid metabolic pathway. (F) The relative mRNA levels of fatty acid associated genes under FDXR depletion from gene expression microarray. (G) Q-PCR and immunoblots assay to detect FDXR and CPT1A level from T47D cells infected with lentivirus encoding Ctrl shRNA and FDXR sh434. (H–J). Seahorse assays (H) and their quantifications of basal OCR (I) and indicated 1 and 2 (J) for measurement of FAO-dependent OCR under the treatment of an FAO inhibitor etomoxir (40 μM) in T47D cells infected with lentivirus encoding Ctrl shRNA and FDXR sh434. *, **, and *** denote P-value of < 0.05, 0.01, and 0.005, respectively. NS denotes not significant.

