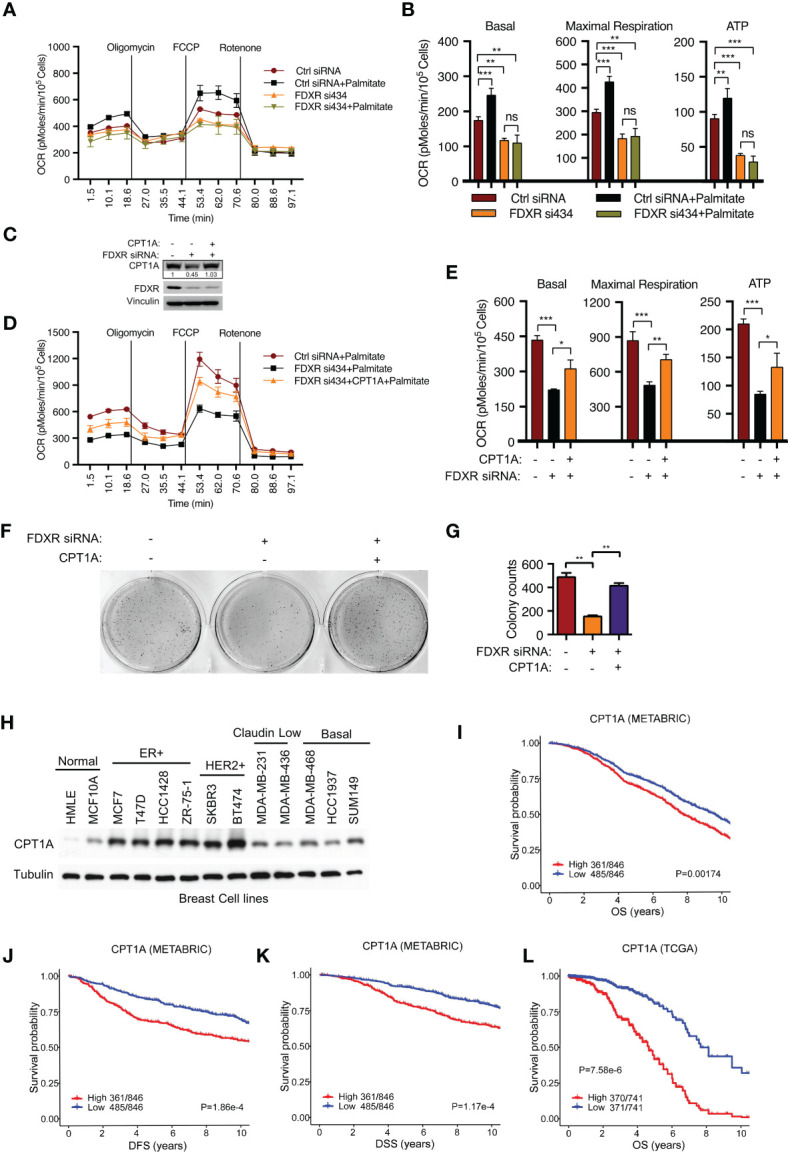
Figure 2.

FDXR regulates fatty acid oxidation and tumor cell growth through CPT1A in ER+ breast cancer cells. (A, B) Seahorse assays (A) and their quantifications of basal, maximal respiration, or ATP production (B) from T47D cells transfected with Ctrl siRNA and FDXR si434. (C–G). Immunoblots (C), Seahorse assays (D) and their quantifications of basal, maximal respiration, or ATP production (E), soft agar assays (F) and their quantifications (G) from T47D cells infected with vector (control) or CPT1A followed by transfection with Ctrl siRNA and FDXR si434. (H) Immunoblots of the breast cell lines as indicated. (I–L). The Kaplan–Meier curves of overall survival (OS) (I, L), disease free survival (DFS) (J), and disease special survival (DSS) (K) based on CPT1A expression in ERα-positive patients from METABRIC (I–K) and TCGA (L) cohorts. Patients were rank-ordered and divided into two equal groups (low in blue and high in red), using the CPT1A gene expression levels. *, **, and *** denote P-value of < 0.05, 0.01, and 0.005, respectively. ns denotes not significant.
