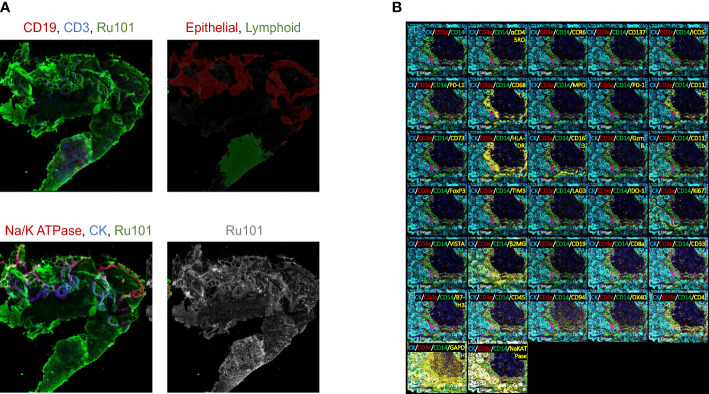
Figure 2.
Immune mass cytometry isolated discrete immune cell populations following tissue segmentation. (A) Fluorescent image of tissue section stained for epithelial and immune cell markers. Upper left: red for CD19, blue for CD3, green for Ru101; Upper right: red for epithelial, green for lymphoid tissue; Bottom left: red for Na/K ATPase, blue for CK, green for Ru101; Bottom right shows Ru101; (B) Tissue section slides stained with multiplex metal-labeled antibody markers. Panel shows the representative image of IMC from an individual sample. Segmentation was performed to demarcate epithelium (cytokeratin, CK) from stroma. Metal-labeled antibody markers are listed in Table 1 .

