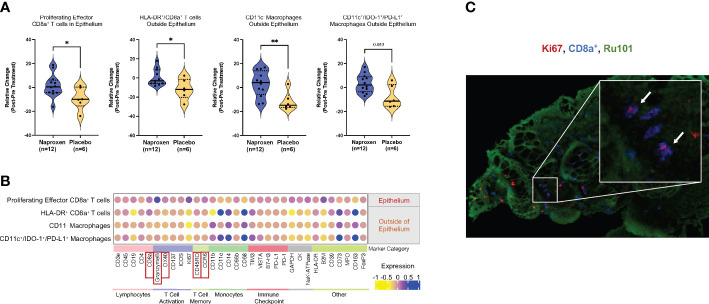
Figure 3.
Chemopreventive naproxen increases activation of cytotoxic T-lymphocytes in the mucosa. (A) Data-driven analysis of the cell population within the mucosa. Change in cell ratio in those immune cell types for the naproxen and placebo groups that showed statistically significant changes. Solid line denotes median and dashed line denotes quartiles. P-values from paired Wilcoxon test from left to right: P=0.032, P=0.048, P=0.0047, P=0.052 (*, P-value<0.05; **, P-value<0.01); (B) Dot-plot graph shows the expression level of stained makers for the four cell types with statistically significant changes between naproxen and placebo groups. The color gradient represents the mean expression level of the corresponding marker in the population. Markers are grouped into categories based on cell type; Red boxes indicate expression markers of highlighted in the text; (C) High-resolution IMC image of Ki67+ (red), CD8a+ (blue), and Ru101 (green) in a LS mucosal sample. The white arrows indicate double-positive CD8+/Ki67+ cells in the colonic mucosa.

