. 2023 Apr 6;11(10):3695–3708. doi: 10.1039/d3bm00035d

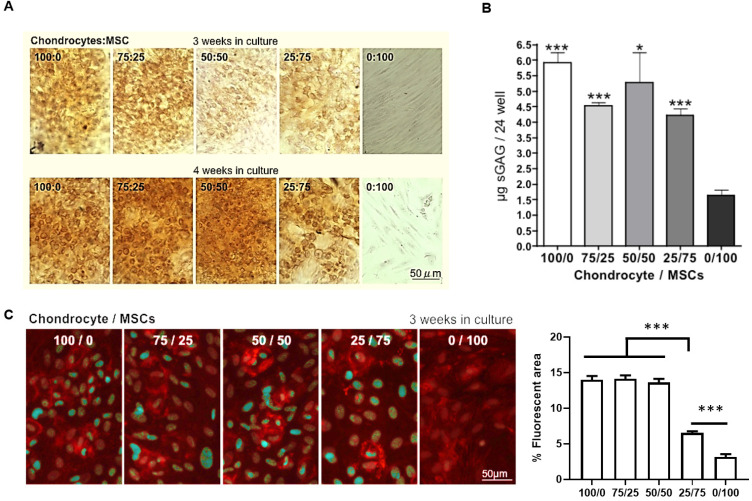
Fig. 5. Effects on cartilage proteoglycan content of co-culturing isolated rabbit chondrocytes with MSC. (A) Safranin O staining for the total cartilaginous proteoglycans content in isolated ear rabbit chondrocytes in co-culture with MSC at different ratios. (B) Quantification of total cartilaginous glycosaminoglycan content by the Blyscan assay in isolated ear rabbit chondrocytes in co-culture with MSC at different ratios. Data are plotted as mean ± SEM. Significant differences between the groups and 0/100 ratio: *p < 0.05; ***p < 0.001. (C) Chondroitin sulfate fluorescent staining in isolated ear rabbit chondrocytes in co-culture with MSC at different ratios. Quantification of percentage of fluorescent area is represented as mean ± SEM. Significant differences between the groups: ***p < 0.001.

Fig. 5