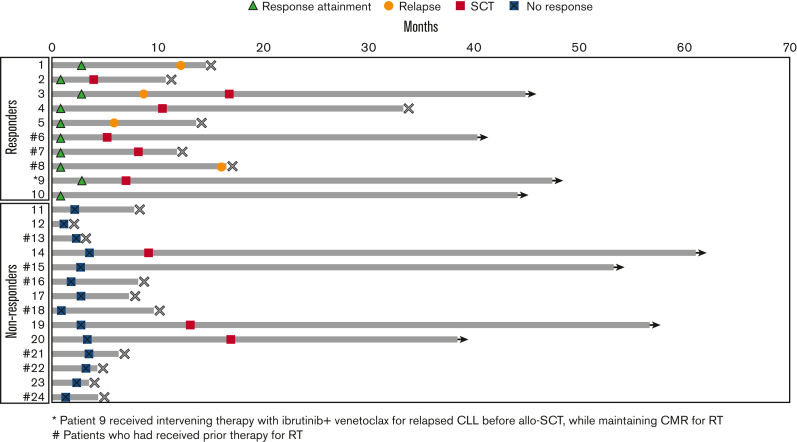
Figure 1.
Swimmer’s plot of the study patients (N = 24). Patients 1 to 10 were responders; 11 to 24 were nonresponders. Patients alive at last follow-up are represented by arrowheads; patients who died are represented by crosses at the end. Time ‘0’ is C1D1 of trial therapy. Relapse has been denoted only for patients who responded to the trial therapy.

