
FIGURE 2.
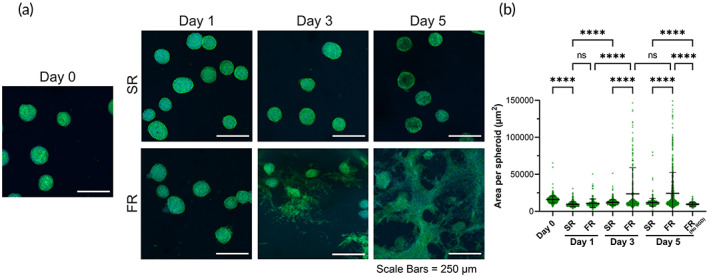
Cell migration from MSC spheroids as function of hydrogel viscoelasticity. (a) Confocal images of spheroids cultured over time in hydrogels without inclusion of PDGF‐BB. Green = actin cytoskeleton. Blue = nucleus. (b) Area per spheroid in SR or FR hydrogels. Spheroids consisted of mouse bone marrow‐derived MSCs. **** and ns indicate p ≤ 0.0001 and statistically not significant (p > 0.05), respectively; Brown–Forsythe and Welch ANOVA tests, followed by Games–Howell's multiple comparisons test. Data points represent individual spheroids, based on n = 161–939 spheroids analyzed per group from three to four biologically independent experiments.