FIGURE 4.

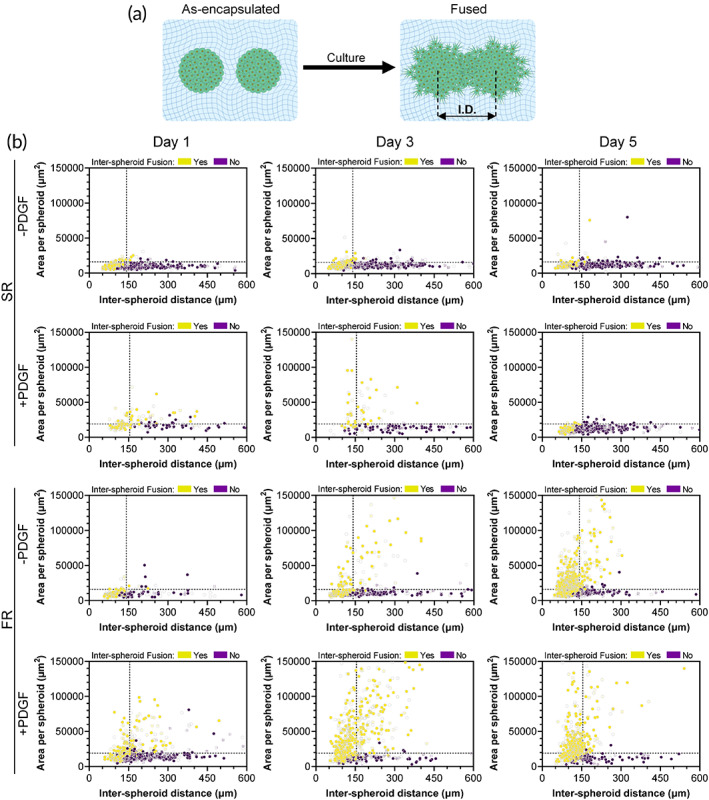
Spheroid behavior as function of inter‐spheroid distance. (a) Schematic illustration of fusion of spheroids at a specific inter‐spheroid distance (I.D.). (b) Scatter plots of spheroid area as a function of inter‐spheroid distance for spheroids encapsulated in slow relaxing (SR) or fast relaxing (FR) hydrogels cultured for up to 5 days in PDGF‐free (−PDGF) or PDGF‐supplemented (+PDGF) media. Horizontal and vertical dashed lines indicate the average spheroid area and the average inter‐spheroid distance of touching spheroids at Day 0, respectively. Yellow and purple dots indicate spheroids that were or were not in direct contact (fused) with at least one neighboring spheroid, respectively. All spheroids consisted of mouse bone marrow MSCs. Data points represent individual spheroids, based on n = 178–939 spheroids analyzed per group from three to four biologically independent experiments.
