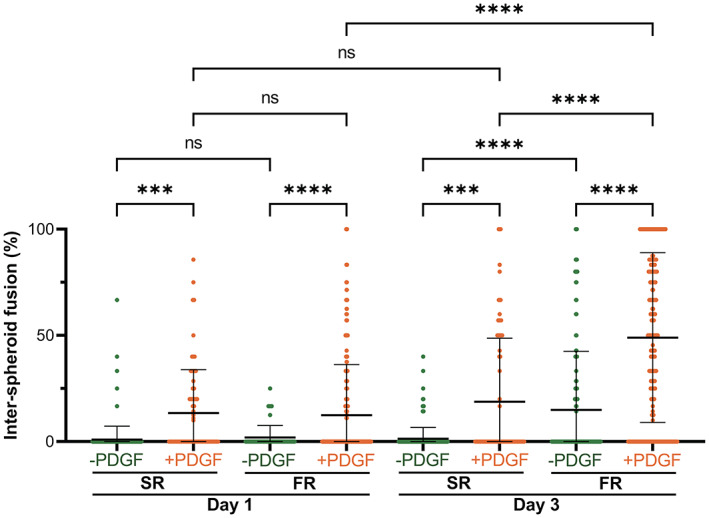
FIGURE 5.

Quantification of inter‐spheroid fusion for spheroids encapsulated in SR or FR hydrogels cultured for 1 or 3 days in PDGF‐free (−PDGF) or PDGF‐supplemented (+PDGF) media. Values were obtained for spheroids positioned within Davg < inter‐spheroid distance < 2 × Davg of their closest neighbor, where Davg is the average spheroid diameter at Day 0. ***, ****, and ns indicate p ≤ 0.001, p ≤ 0.0001, and statistically not significant (p > 0.05), respectively; Brown–Forsythe and Welch ANOVA tests, followed by Games–Howell's multiple comparisons test. Data points represent individual spheroids, based on n = 51–374 spheroids analyzed per group from three to four biologically independent experiments. All spheroids consisted of mouse bone marrow MSCs.
