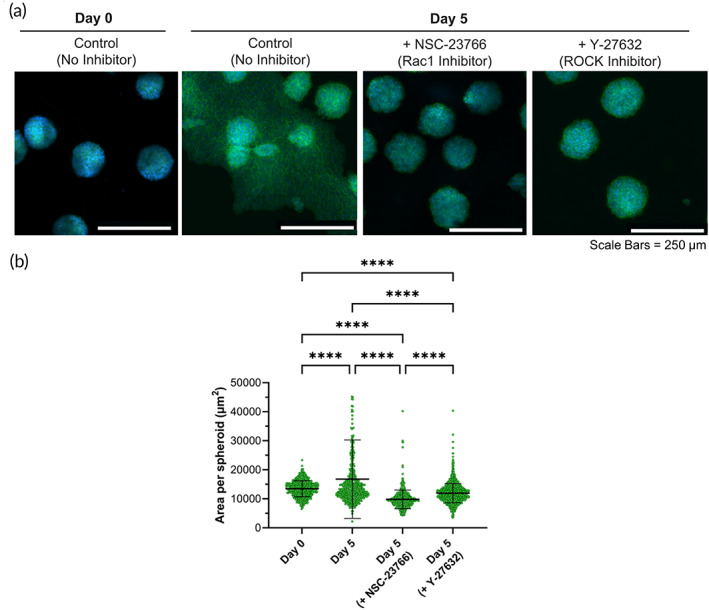
FIGURE 6.

Role of Rac1 and ROCK. (a) Confocal images of MSC spheroids encapsulated in FR hydrogels cultured in growth medium supplemented with NSC‐23766 (Rac1 GTPase inhibitor) and Y‐27632 (ROCK inhibitor). Green = actin cytoskeleton. Blue = nucleus. (b) Area per spheroid cultured over time in FR hydrogels, without or with inhibitors. **** indicates p ≤ 0.0001; Brown–Forsythe and Welch ANOVA tests, followed by Games–Howell's multiple comparisons test. Data points represent individual spheroids, based on n = 563–1333 spheroids analyzed per group from three to four biologically independent experiments.
