FIGURE 2.

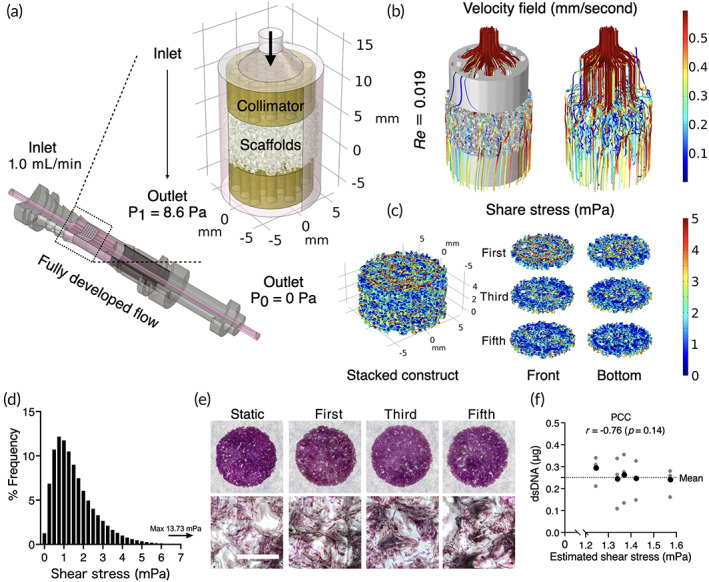
Computational fluid dynamics (CFD) for fluid shear stress estimation (a) The scaffold geometry obtained by a micro computed tomography was virtually placed in the scaffold chambers where fully developed flow at 1.0 mL/min was provided at the inlet. At the outlet of the chamber, atmospheric pressure was prescribed (P0), which determined pressure at the end of collimators on the outlet side at 8.6 Pa (P1). (b) Fluid paths were simulated evenly among the scaffolds with Reynolds number at 0.019, indicating the flow was laminar. (c) Simulation of fluid shear stress on the surfaces of first, third, and fifth scaffolds in the stack showed local shear distribution. (d) Frequent distribution of fluid shear stress ranged from 1.5e‐008 to 13.73 mPa. (e) Crystal violet staining showed actual cell distribution among the scaffold stacks. (f) Pearson correlation coefficient (PCC) indicated no correlation between the estimated shear stress and harvested double‐strand DNA (dsDNA) from the scaffolds at different position after 7 days of perfusion culture. Mean of harvested dsDNA (in black) were calculated from three independent samples (in gray). Scale bar = 1 mm.
