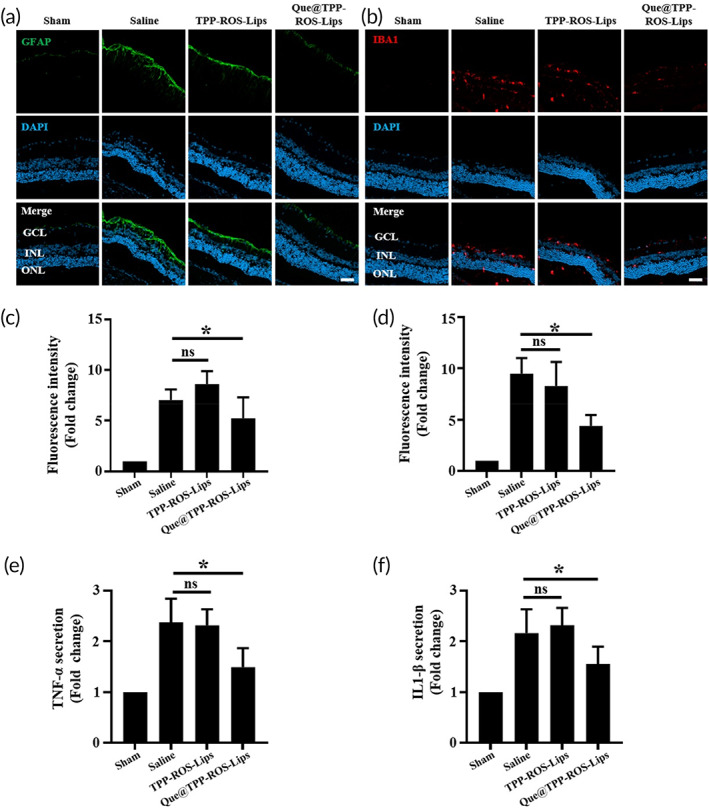
FIGURE 6.

Inhibition of the RIR‐induced activation of retinal gliocytes and inflammatory cytokine secretion by Que@TPP‐ROS‐Lips following intravitreal injection. Representative CLSM images showing the levels of GFAP (a) and IBA1 (b) in retinal cryosections collected at 7 days after injection. Fluorescence intensities of GFAP (c) and IBA1 (d) quantified by ImageJ software (scale bar = 50 μm; n = 6; *p < 0.05 compared with the saline group). Levels of TNF‐α (e) and IL‐1β (f) determined by the ELISA. The results represent mean ± SD of fold change (scale bar = 50 μm; n = 6; *p < 0.05 compared with the saline group).
