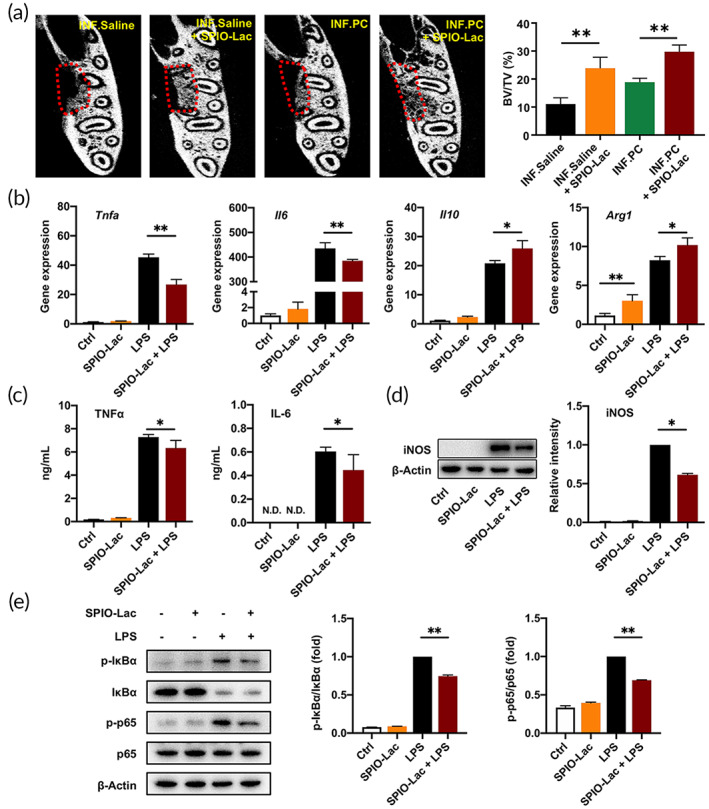
FIGURE 8.

(a) Evaluation of periodontal bone regeneration promoted by SPIO‐Lac using micro‐CT and quantitative analysis of BV/TV at 2 weeks after surgery. (b) RAW264.7 cells were treated with 106/ml SPIO‐Lac for 2 h and stimulated with LPS. qRT‐PCR analysis of the M1‐related gene expression levels, including Tnfa and Il6, and the M2‐related gene expression levels, including Il10 and Arg1 at 6 h after LPS induction. (c) Concentrations of TNFα and IL‐6 in the cell culture supernatant measured by ELISA at 24 h after LPS induction. (d) Relative protein levels of iNOS determined by western blotting at 24 h after LPS induction. (e) Western blotting and quantification analysis of total IκBα, phosphorylated (p‐) IκBα, p65, and phosphorylated (p‐) p65 at 30 min after LPS induction. (n = 3) (*p < 0.05, **p < 0.01)
