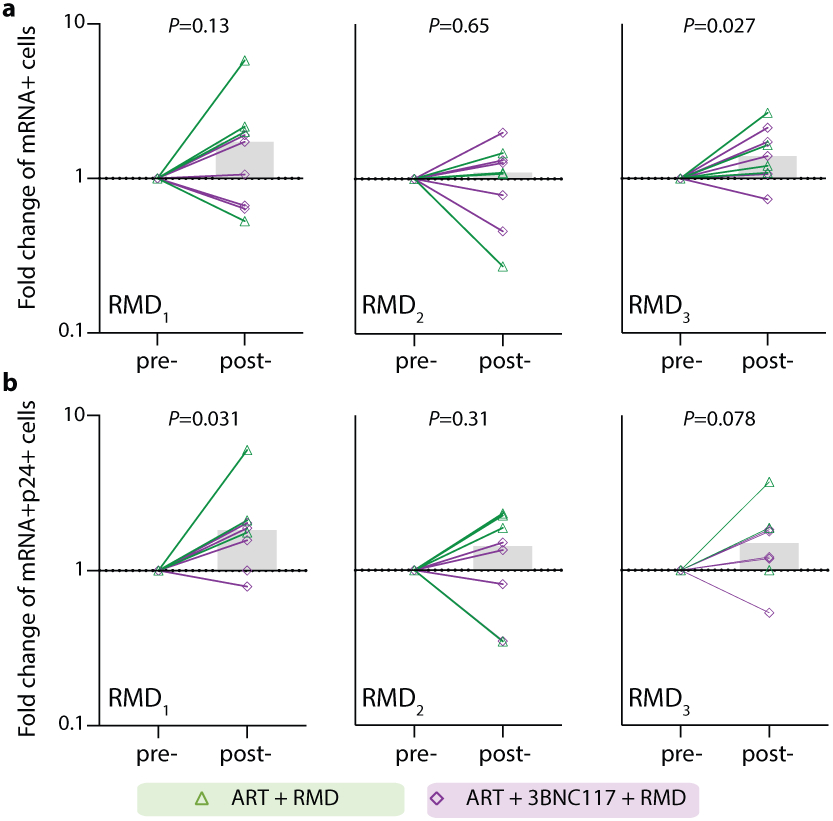
Extended Data Fig. 6. Effect of RMD on transcriptionally (mRNA+) and transcriptionally + translationally (mRNA+p24+) active HIV-1-infected cells.

Data are shown as in Fig. 3f-g. Individual and overall median fold change (column) from pre- to post-RMD infusions in groups ART+RMD (n=8) and ART+3BNC117+RMD (n=10) on CD3+CD8− T cells expressing HIV-1 mRNA (a) or mRNA and Gag p24 (b). P values comparing within group was calculated using paired two-tailed Wilcoxon test. Due to a faulty mRNA probe in the 2nd batch of fluorescence in situ hybridization-flow cytometry analyses, mRNA data was only available for half of the study population.
ART, antiretroviral therapy; RMD, romidepsin.
