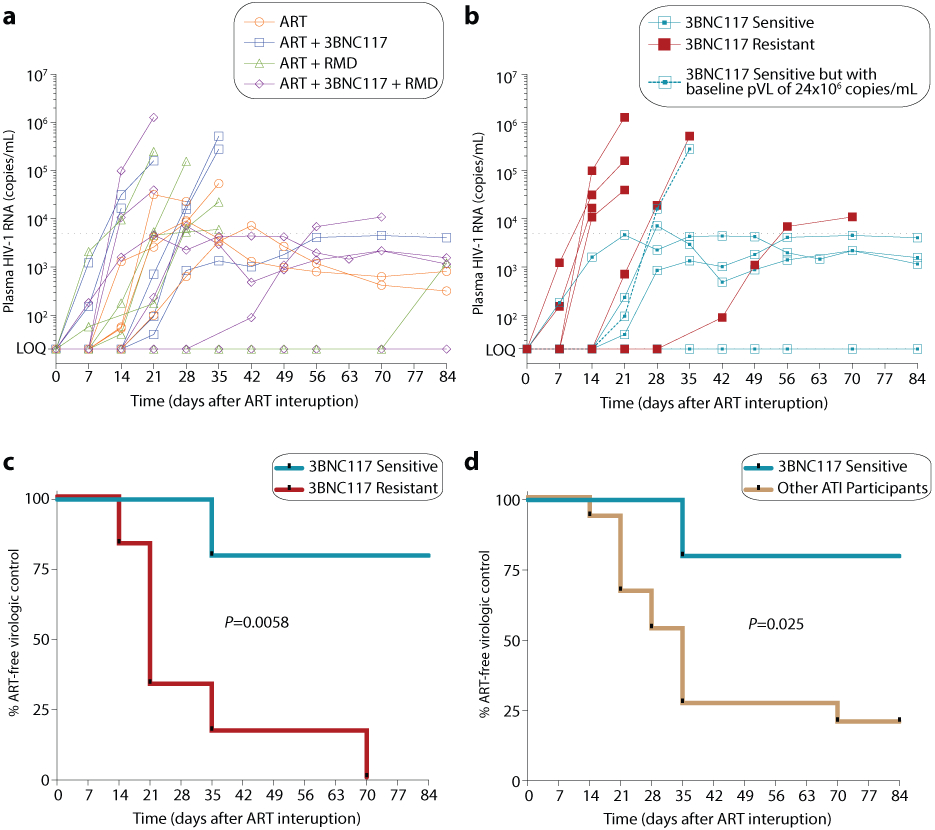
Figure 5. Time to loss of virologic control during 12 weeks of analytical treatment interruption.

Individual (n=20) plasma HIV-1 RNA levels are shown and coded by group (a). One individual (id. 125) resumed ART prior to fulfilling the restarting criteria due to national restrictions during the COVID-19 pandemic. Individual (n=11) plasma HIV-1 RNA levels for the ART+3BNC117 and ART+3BNC117+RMD groups based on 3BNC117-sensitivity (b). Kaplan-Meier curves showing percentage of individuals still interrupting ART from day 0 to day 84 during the ATI (c-d). Time to loss of virologic control for the ART+3BNC117 and ART+3BNC117+RMD groups based on 3BNC117-sensitivity (sensitive n=5 versus resistant n=6) (c) and for the 3BNC117-sensitive individuals (n=5) compared to the other ATI participants (n=15) (d) are shown. P values were calculated using log-rank test.
ART, antiretroviral therapy; ATI, analytical treatment interruption; COVID-19, coronavirus disease 2019; LOQ, limit of quantification; RMD, romidepsin.
