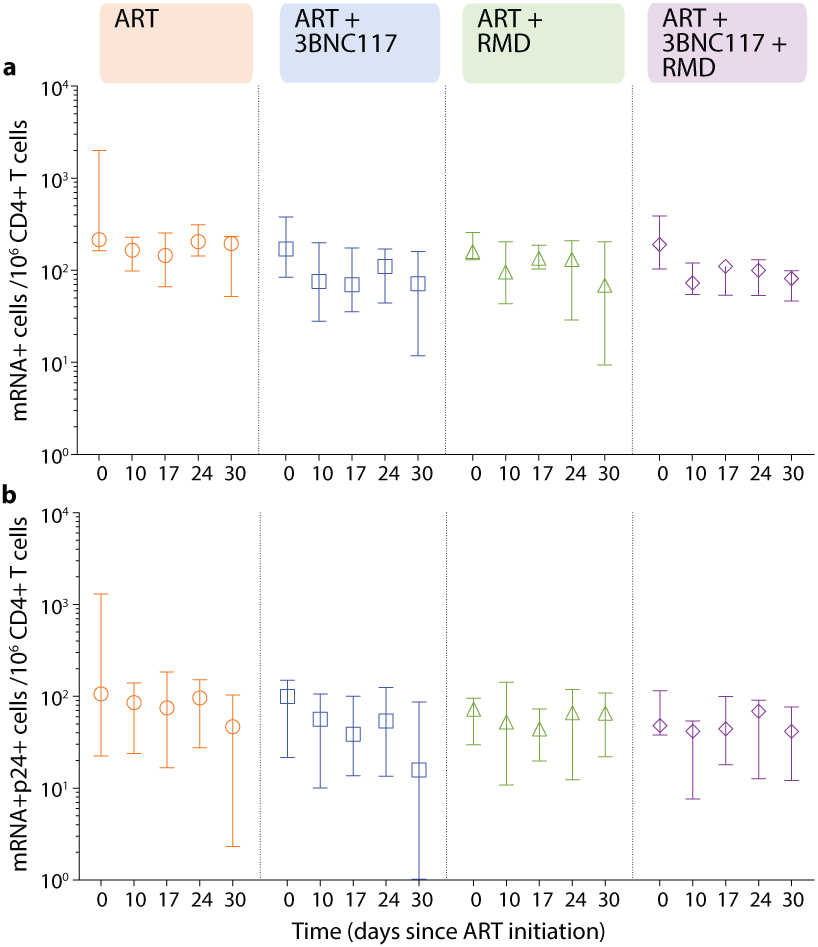
Extended Data Fig. 3. Transcriptionally (mRNA+) and transcriptionally + translationally (mRNA+p24+) active HIV-1-infected cells following ART initiation.

Changes in HIV-1-infected cells during the first 30 days of ART among the four groups shown as median (error bars represents interquartile ranges) number of CD3+CD8− T cells expressing either HIV-1 mRNA (a) or HIV-1 mRNA and Gag p24 protein (b). ART-control n=4, ART+3BNC117 n=5, ART+RMD n=4, ART+3BNC117+RMD n=5.
ART, antiretroviral therapy; RMD, romidepsin.
