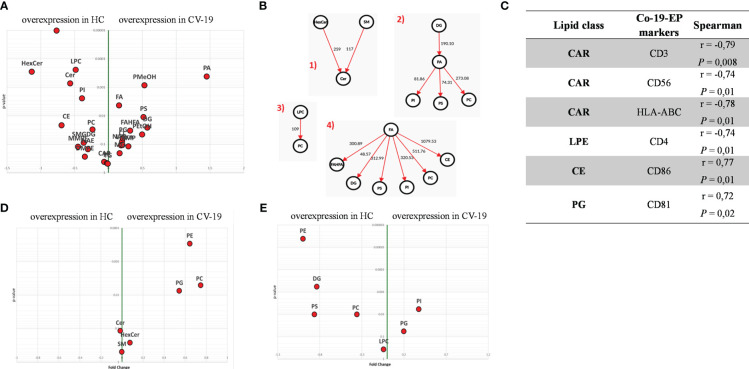
Figure 2.
(A) Volcano plot of lipid classes. Top left and top right show the lipid classes overexpressed in Co-19-EPs and HC-EPs, respectively. (B) Network of transformations between lipid classes: significant changes (P<0.05) between lipid classes can be interpreted using known biochemical pathways as reference. Both graphs were made with Excel and Graph Editor from data produced with the lipid class overview fiction of LipidOne. The numbers in the diagram indicate the intensity of the reaction on an arbitrary scale. (C) Table reporting the association between lipid classes and MFI of markers on Co-19-EPs using Spearman’s correlation analysis and presented as rank coefficient (r) and P value. Volcano plot of the ratio of oxidized/reduced species (D) and the ether/ester-linked ratio (E). The figure shows that the phosphatidylethanolamine (PE), phosphatidylcholine (PC) and Phosphatidylglycerol (PG) classes contain oxidized species and that EPs from COVID-19 patients are enriched in these oxidized species (P<0.01). In contrast, EPs from HC are enriched in lipid classes containing ether linkages (PE, diacylglycerol (DG), phosphatidylserine (PS) and PC) (P<0.01).

