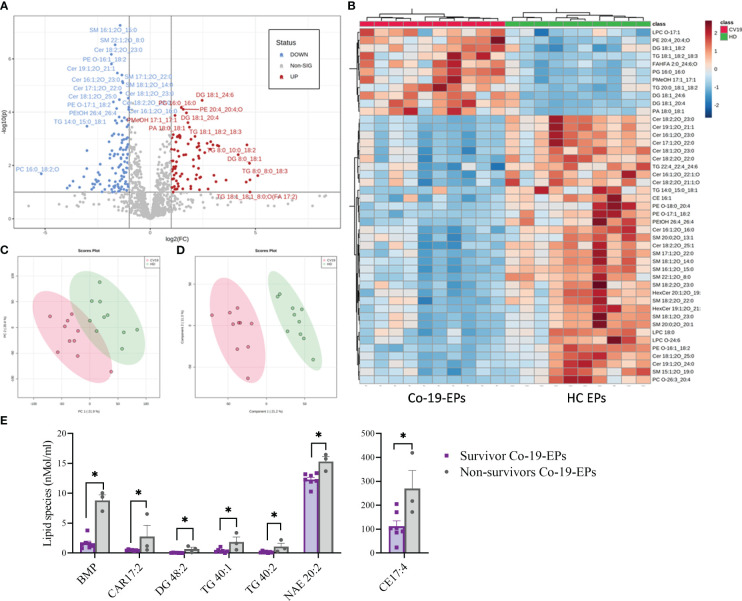
Figure 3.
Volcano Plot (A), Heat Map (B), Principal Component Analysis (PCA) (C) and Partial least squares-discriminant analysis (PLS-DA) (D) of Lipidomic dataset for EPs from COVID-19 patients and HC (n=10, respectively). (E) Significant difference ins specific lipid species (namely Bis(monoacylglycero)phosphate (BMP), O-acyl-R-carnitine (CAR)17:2, diacylglycerol (DG) 48:2, triacylglycerol (TG) 40:1, TG 40:2, N-acylethanolamine (NAE) 20:2) between survivors and non-survivors COVID-19 patients (n=7 vs n=3). *P<0.05.

