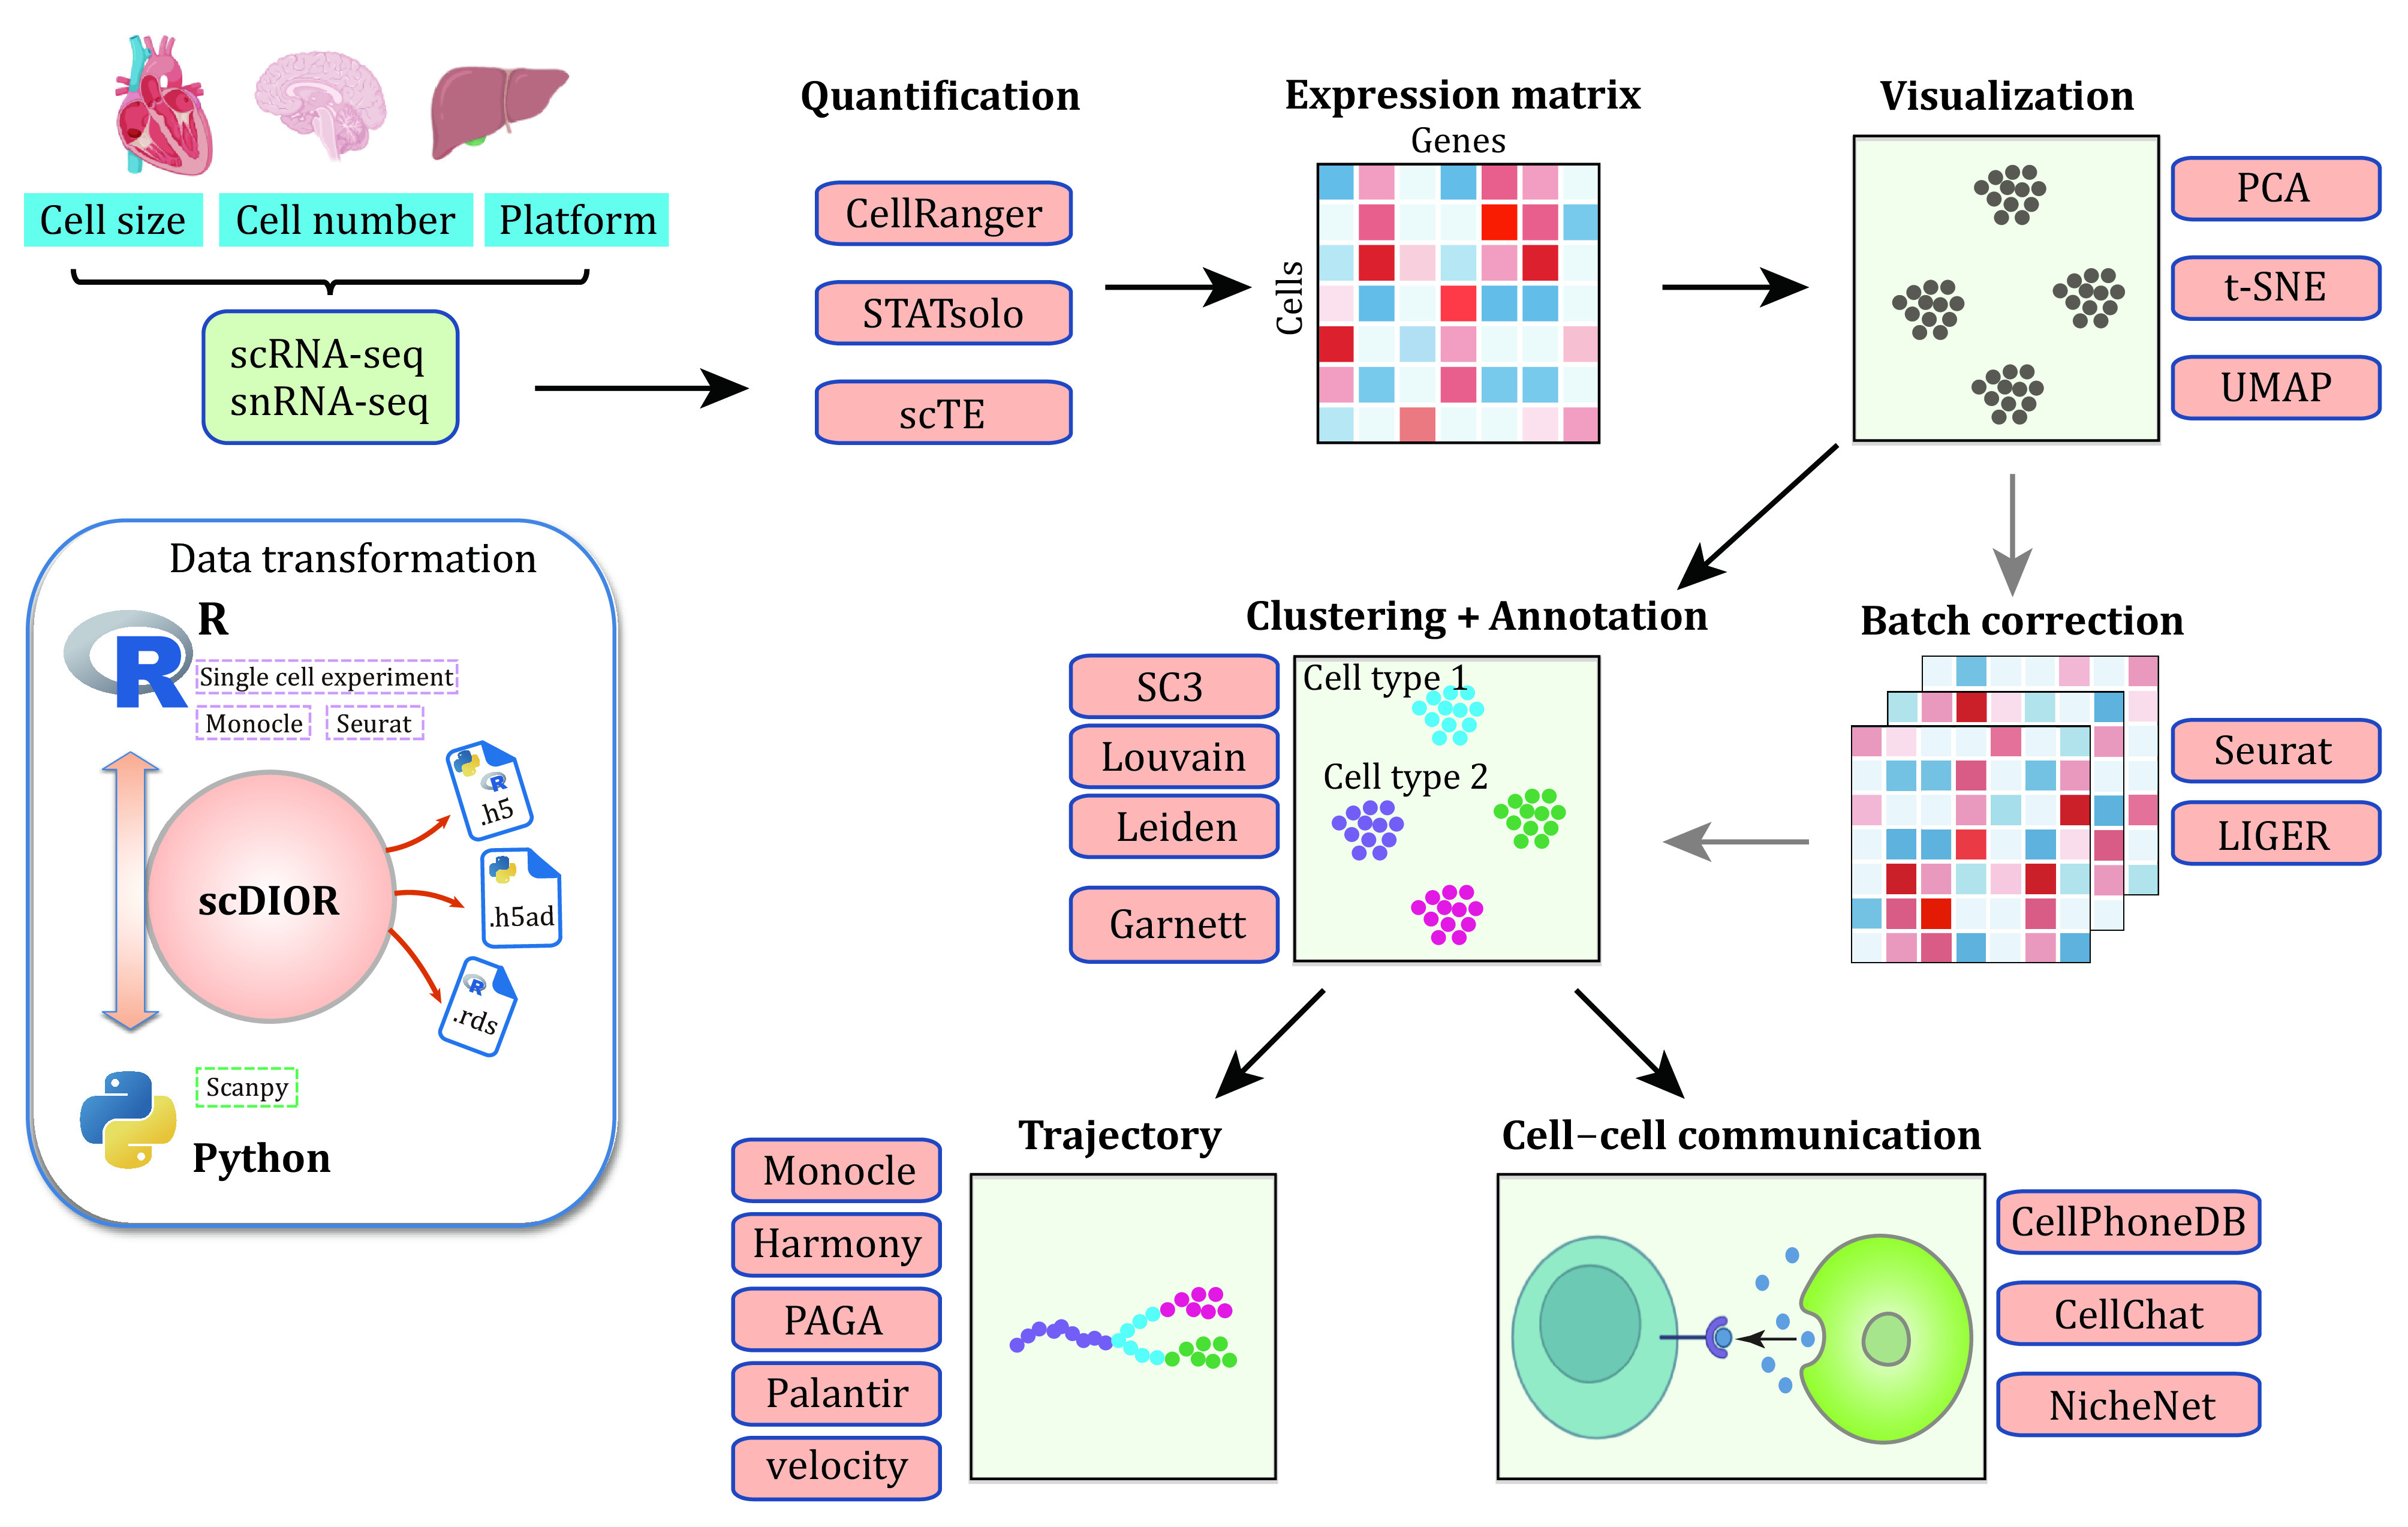
Figure 1.

Overview of scRNA-seq data analysis workflow. Typically, the researchers must first consider which platform of single-cell are needed as each has its benefits and limitations. After sequencing, the expression matrices can be obtained by quantification tools. Sometimes, researchers need to combine expression matrices using batch correction methods. Next, the data are visualized by dimensionality reduction, and clustered and annotated for biological interpretation, or ordered the cells along a predicted trajectory in pseudotime, or inferring for cell-cell communication. Suggested tools are listed in the colored box
