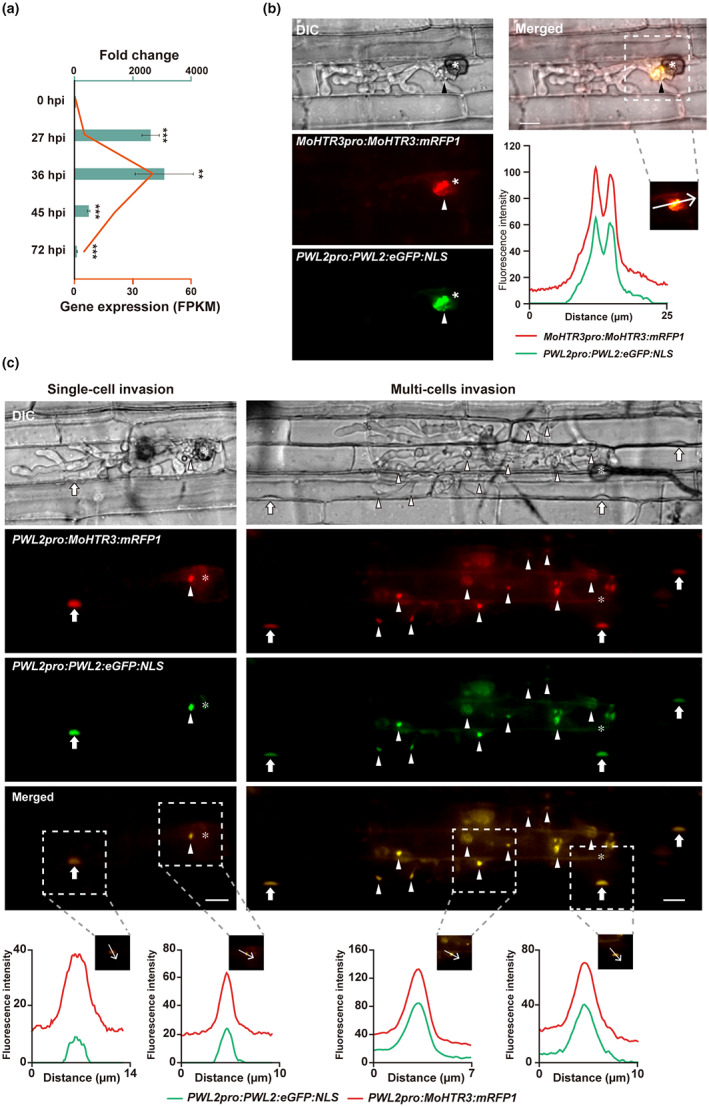
FIGURE 3.

MoHTR3 is expressed in the biotrophic stage and accumulates in the biotrophic interfacial complex (BIC) and plant nuclei. (a) In planta expression of MoHTR3 at different time points after infection by reverse transcription‐quantitative PCR (RT‐qPCR). RNA sequencing‐based expression data (Jeon et al., 2020) were reanalysed on MoHTR3 transcript abundance (fragments per kb of transcript per million mapped reads [FPKM]). (b) To observe the location of MoHTR3, we used an mRFP1‐tagged strain under the control of the native promoter MoHTR3pro. PWL2pro:PWL2:eGFP:NLS was codetected after sheath inoculation at 36 h postinoculation (hpi). (c) Translocation and nuclear accumulation of MoHTR3, driven by the PWL2pro promoter, producing high protein abundance. MoHTR3:mRFP1 colocalizes with PWL2:eGFP:NLS in the host plant. Arrowhead, BIC; white arrow, plant nucleus; asterisk, infection site; DIC, differential interference contrast microscopy. The area of fluorescence intensity determination is indicated within the merged image. Scale bars, 10 μm.
