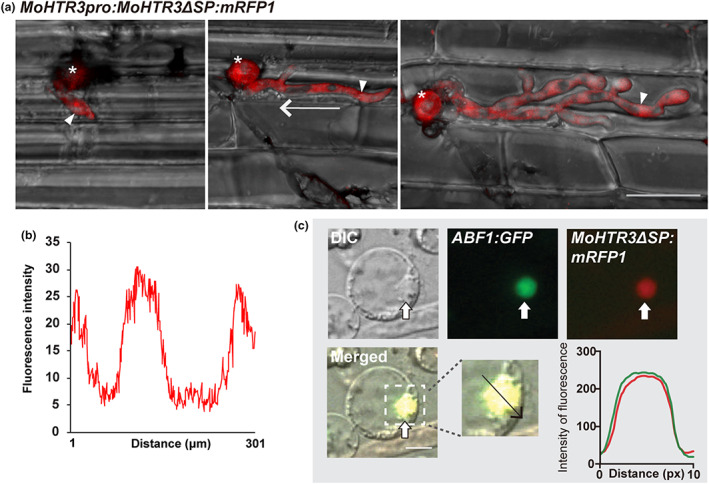
FIGURE 4.

MoHTR3 localization to the biotrophic interfacial complex (BIC) depends on the signal peptide (SP) domain. (a, b) Representative confocal laser‐scanning microscopy images of the localization of MoHTR3ΔSP tagged with mRFP1 at different developmental stages until 36 h postinoculation. Depicted are 3D maximum projections of z‐stacks, with a focal plane distance of 1 μm within a total range of about 20 μm. Animated 3D projections are provided in Movies S1 and S2 (MoHTR3:mRFP1 control in Figure S3c and Movie S1). White arrowhead, invasive hypha; asterisk, infection site; white arrow indicates the area of fluorescence intensity measurement in (b). (c) MoHTR3 without the signal peptide domain (ΔSP) was localized in rice protoplasts. MoHTR3ΔSP colocalizes with the nuclear marker ABF1:GFP. White arrow, plant nucleus; the black arrow indicates the area of fluorescence intensity determination; DIC, differential interference microscopy. Scale bars, 20 μm (a) and 5 μm (c).
