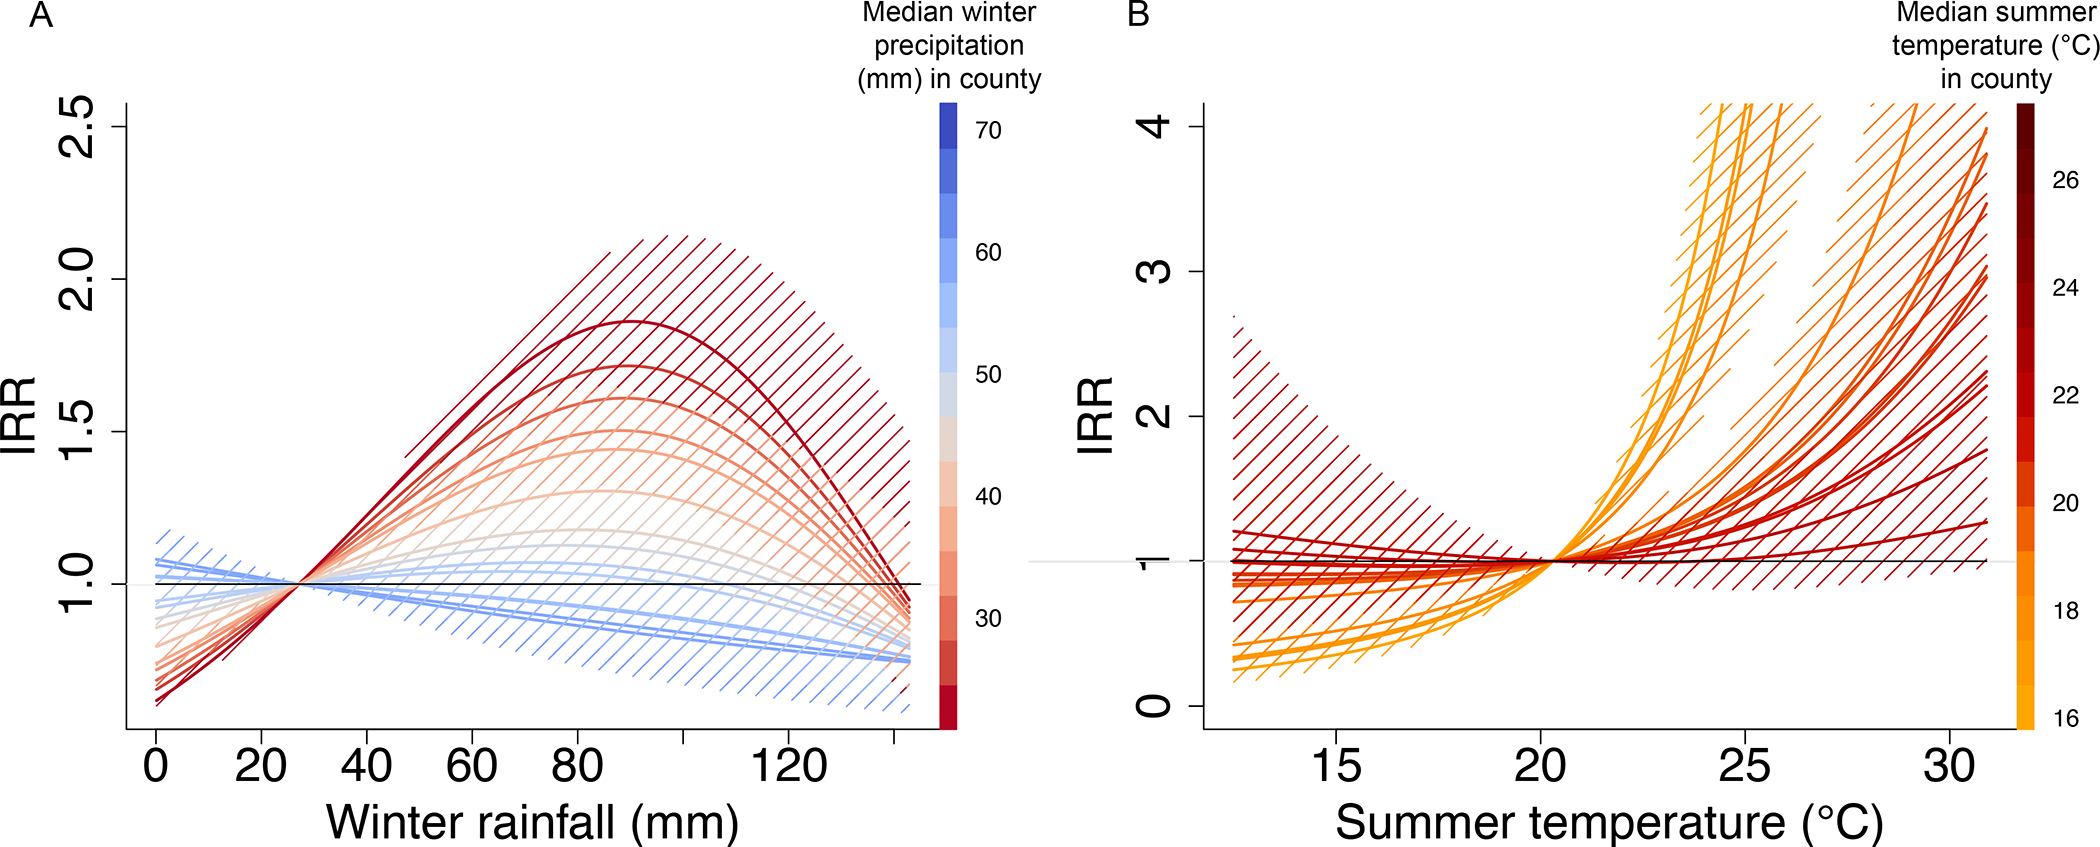
Figure 3.

Increases in winter precipitation or summer temperature had the greatest effect in regions where rain was scarce or temperatures were low, respectively. (A) Estimated exposure-response relationships expressed as incidence rate ratios (IRR; colored lines) corresponding to the effect of changing winter precipitation and (B) summer temperature from a reference level to the value shown. The reference level for the IRR is the 25th percentile for the study region (for which IRR=1). Each line indicates an exposure-response relationship expressed as the incidence rate ratio for a given temperature or precipitation value compared to the incidence rate at the 25th percentile condition for a given county, based on the county’s median winter precipitation (A) or median mean summer temperature (B). Dashed regions around the solid lines indicate 95% confidence intervals. IRR = incidence rate ratio
