
Figure 4.
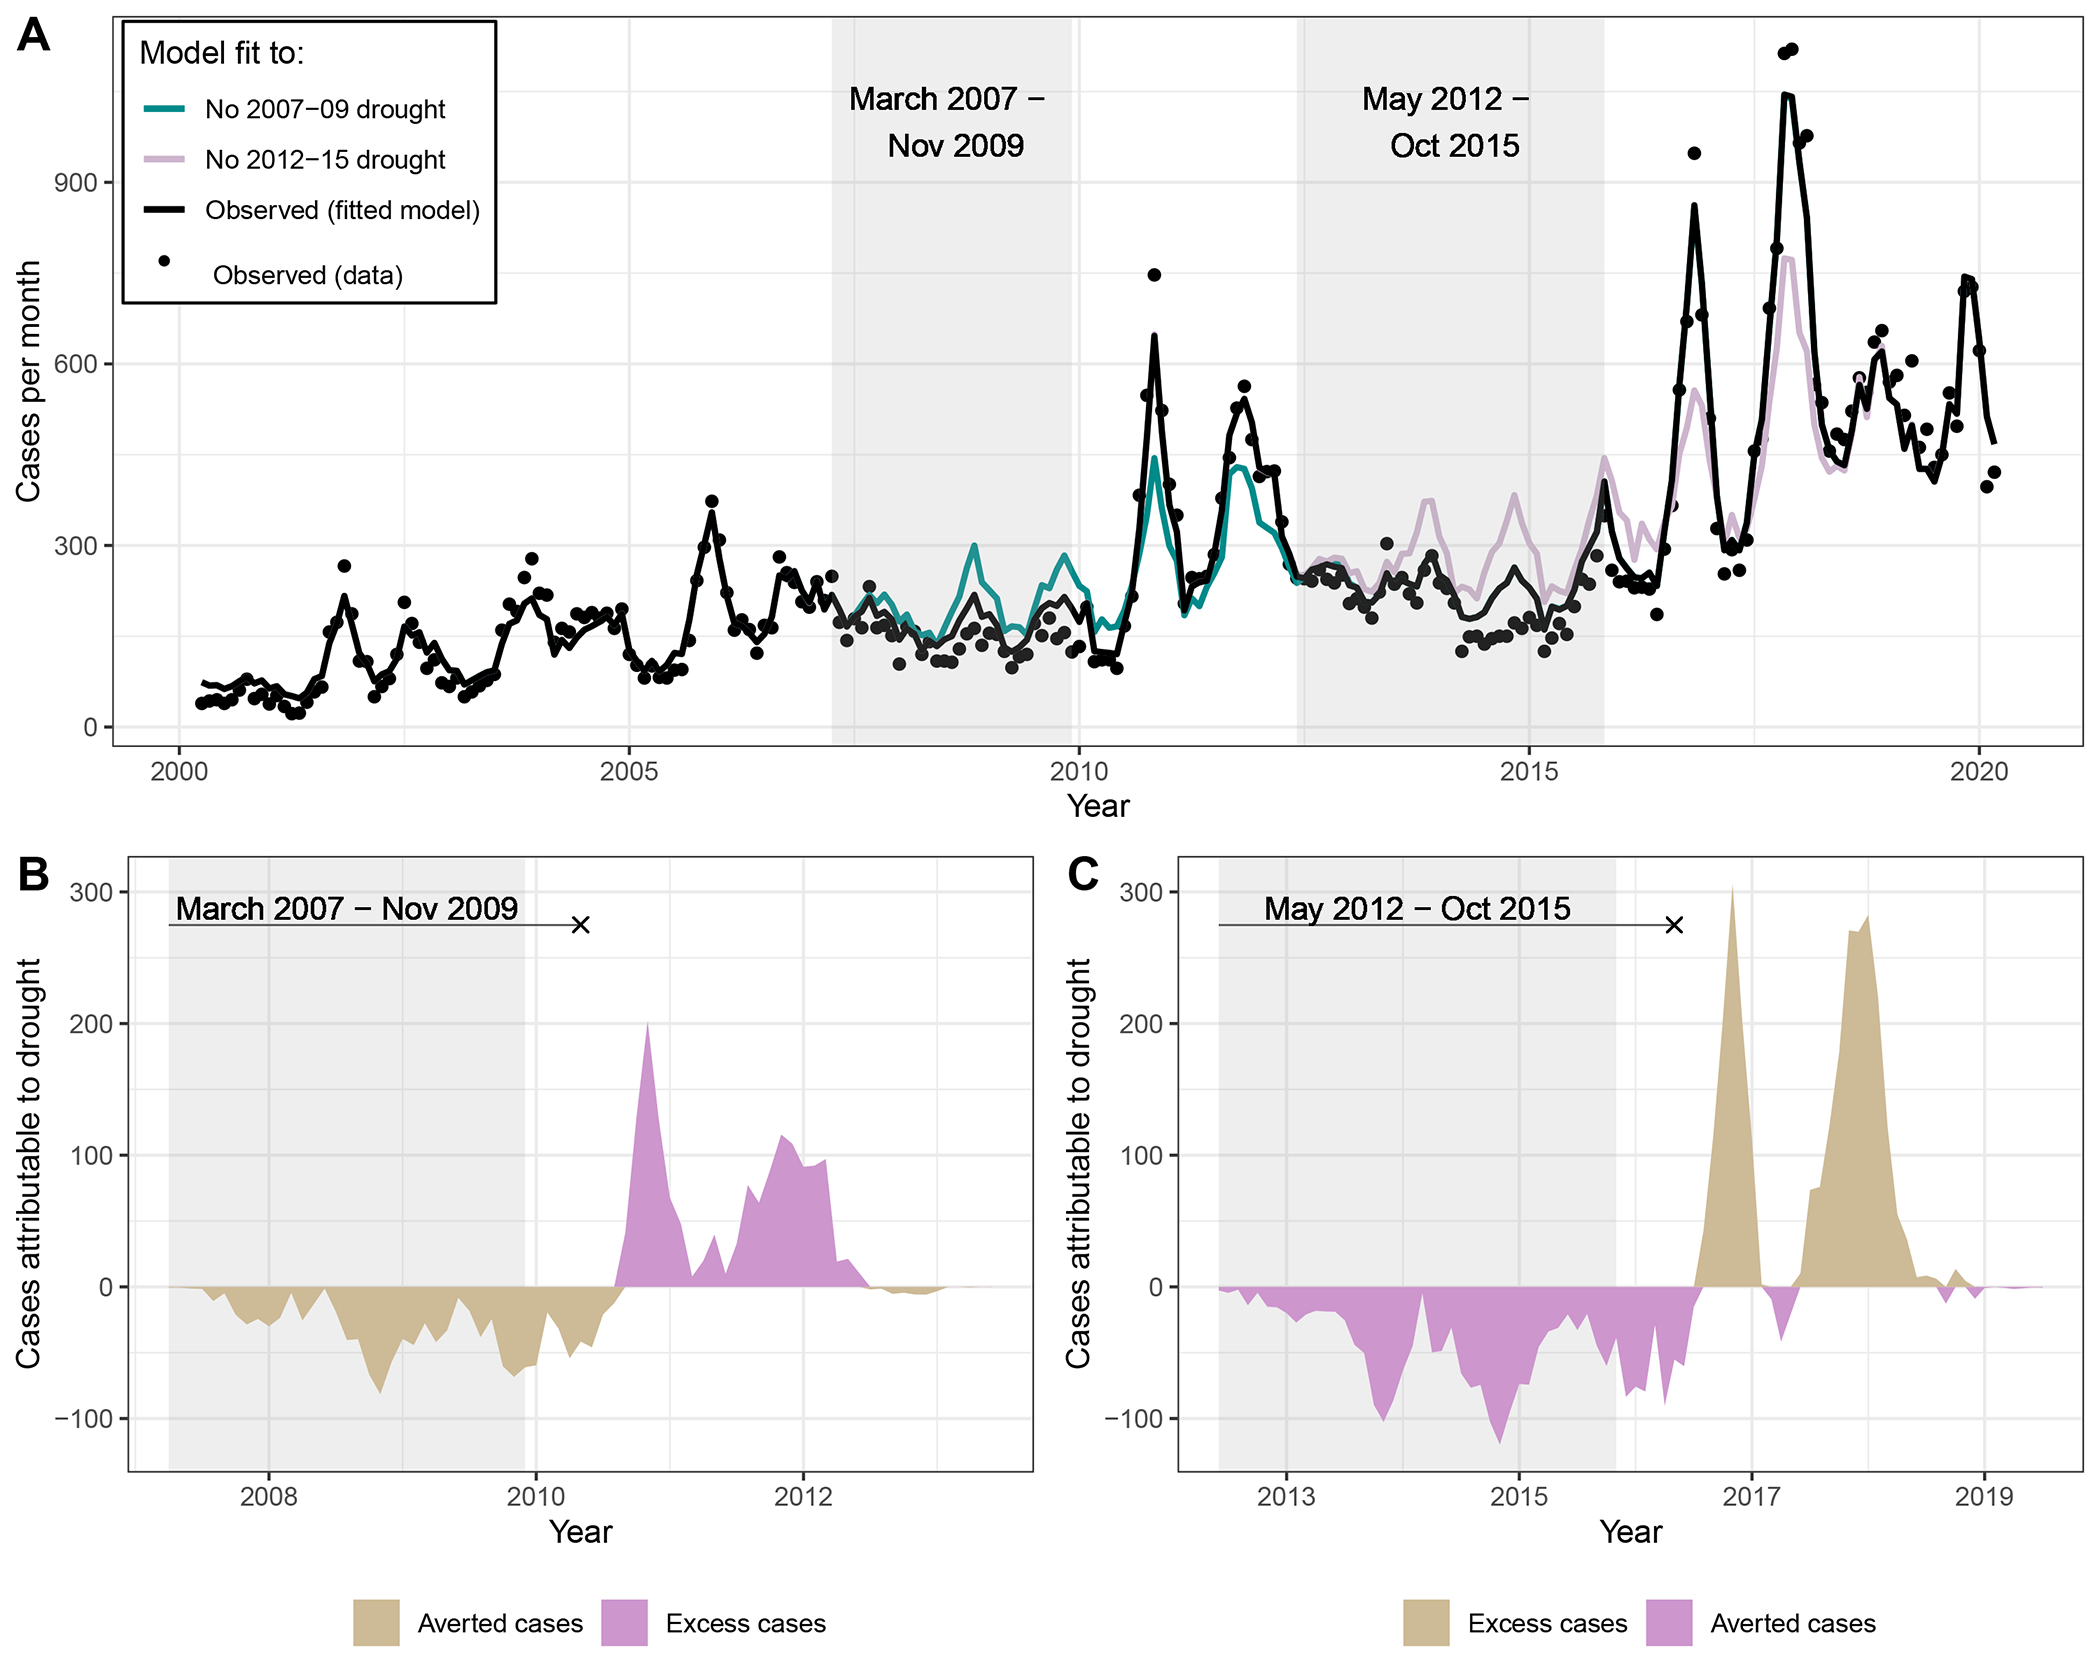
Droughts were associated with reduced incidence during the drought, and excess incidence following the drought. (A) Observed incidence (black dots) by month within the study region. Black line is the model fit under the observed environmental conditions. Color lines represent the expected incidence under the counterfactual intervention if the 2007–09 drought did not occur (cyan) or the 2012–15 drought did not occur (pink). Counterfactual scenarios were generated by setting temperatures observed to be higher than historical averages, and precipitation values observed to be below historical averages, deterministically to their average values. Gray boxes indicate the drought period. (B and C) Difference between expected cases and counterfactual cases if the 2007–09 (B) and the 2012–15 (C) droughts had not occurred, respectively. In B and C, the line symbol “——x” indicates the period that encompasses the drought and lasts until the end of the transmission season (March 31).