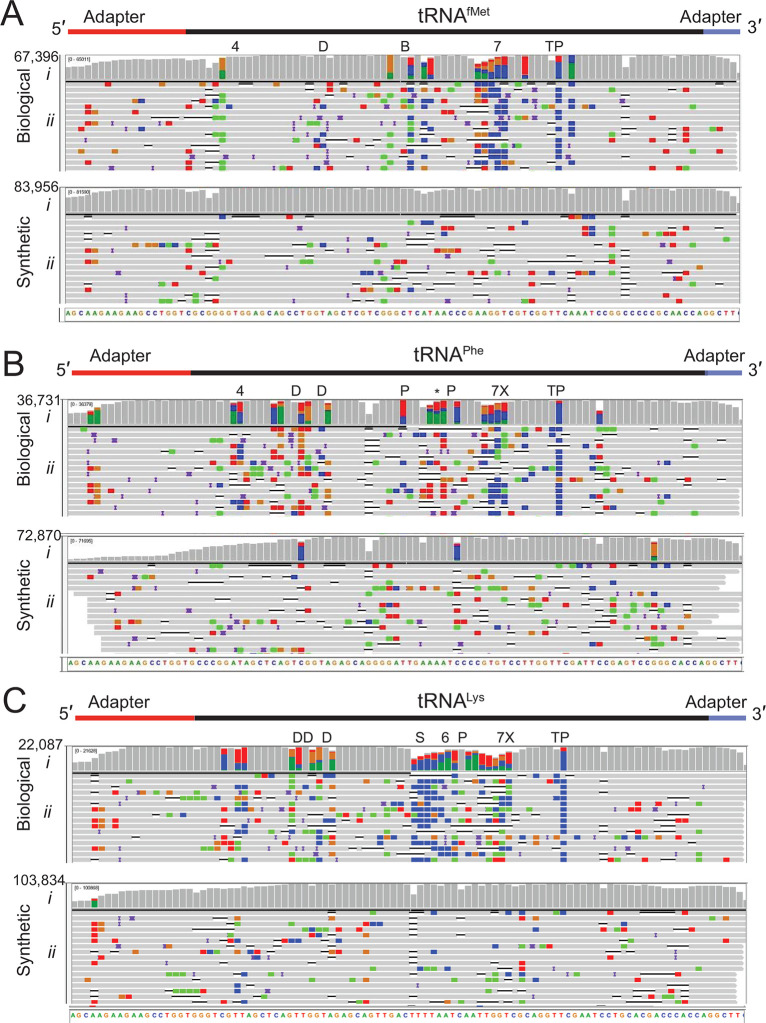
Figure 2.
Biological and canonical tRNA strand reads aligned against reference sequences. (A) tRNAfMet, (B) tRNAPhe, and (C) tRNALys. In each panel (i) is base coverage along the reference sequence at each position (coverage plot) and (ii) is a randomly selected subset of individual aligned nanopore reads. The total numbers of aligned reads are shown to the left of the coverage plots. The positions of expected modifications on biological tRNA3 are indicated above the coverage plots and are abbreviated: 4 = 4-thiouridine; D = Dihydrouridine; B = 2′-O-methylcytidine; 7 = 7-methylguanosine; T = 5-methyluridine; P = pseudouridine; X = 3-(3-amino-3-carboxypropyl)uridine; * = 2-methylthio-N6-isopentenyladenosine; S = 5-methyl-aminomethyl-2-thiouridine; and 6 = N6-threonylcarbamoyl-adenosine. Gray columns in the coverage plots indicate positions along the reference where 80% or more of the quality weighted reads are the expected canonical nucleotide. At positions where the value is under the 80% threshold, the proportion of each nucleotide call is shown in color where U(T) = red, A = green, C = blue, and G = gold. Similarly, the rows of individual aligned reads (A–C, ii) are gray at positions matching the reference and colored (using the previously mentioned convention) at positions with mismatches. The black horizontal bars in the aligned reads indicate a deletion, and purple bars indicate an insertion. The rows of aligned reads are presented as they were displayed on IGV.21

