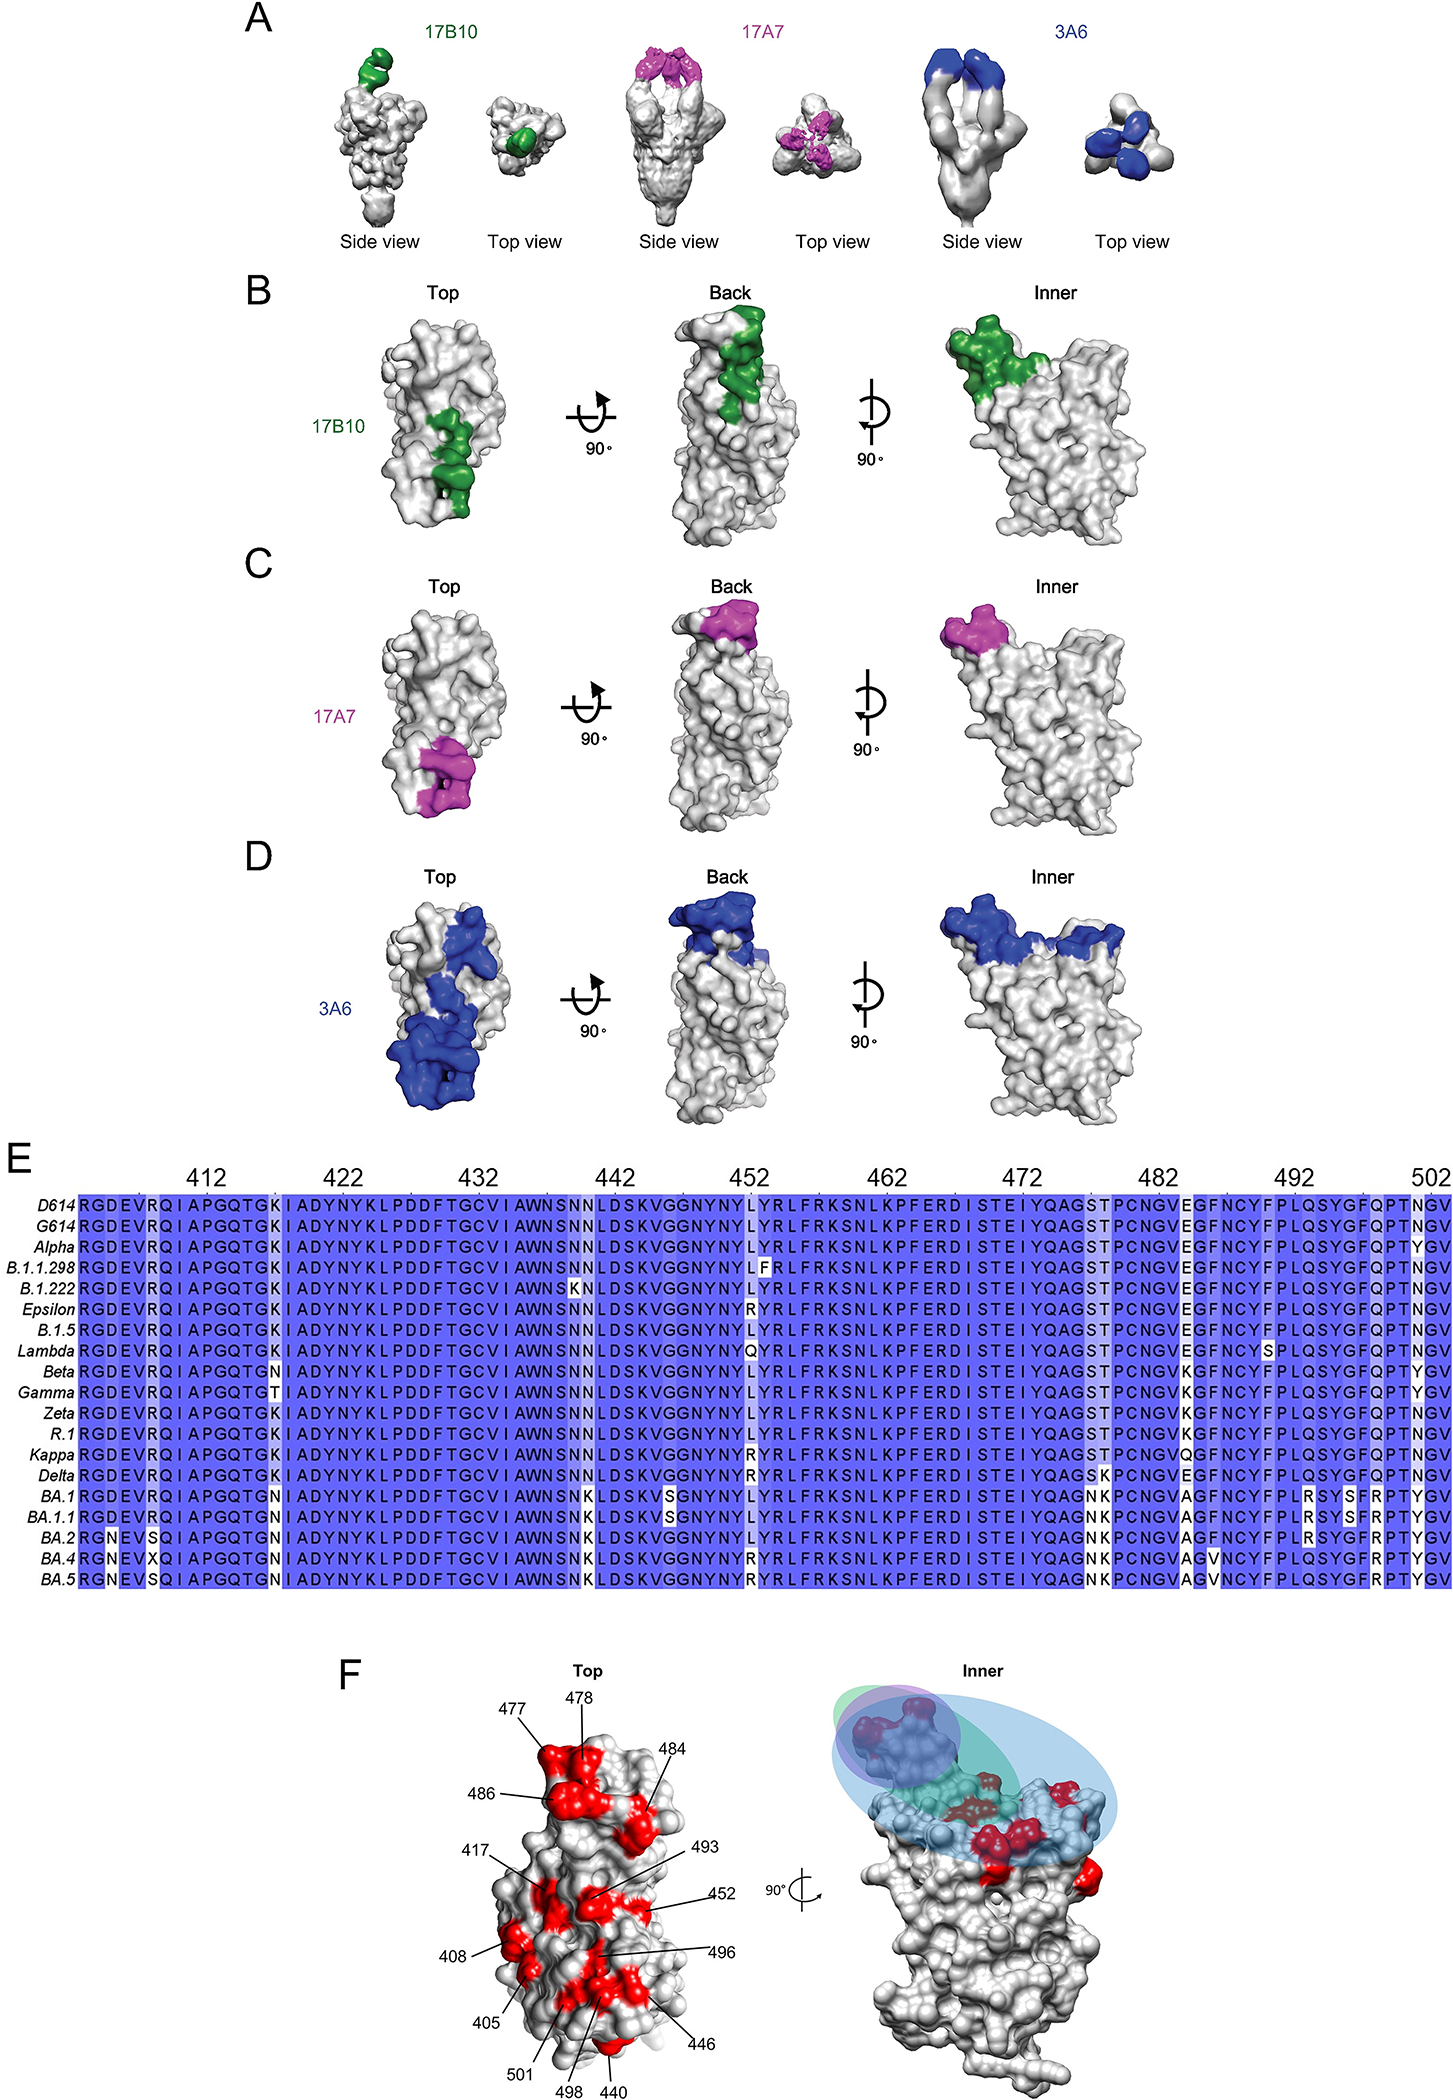
Figure 8.

17B10, 17A7 and 3A6 Fab bound to different regions of RBD. The 3D map of 17B10-Spike complex was produced by low-pass filter 17B10-S complex cryo-EM map to 10Å. The 3D maps of 17A7-S and 3A6-S complexes were produced by negative stain EM with a resolution at 11Å and 13Å, respectively. (A) Top view and side view of 3D reconstruction of Fab-spike (gray) complexes. (B-D) Binding footprints of Fabs of three neutralizing antibodies, 17B10 (B), 17A7(C) and 3A6 (D) shading on the RBD in surface representation. The RBD surface (gray) was represented in three views (top, back and inner). The Fabs are colored as 17B10: green; 17A7: magenta; 3A6: blue. (E) Sequence alignment showing multiple mutations in the RBD region (aa 403–503) among SARS-CoV-2 variants. (F) The positions on the RBD being mutated in Omicron subvariants highlighted in red with the colored footprints of 17B10 (green), 17A7 (magenta) and 3A6 (blue).
