Figure 4.

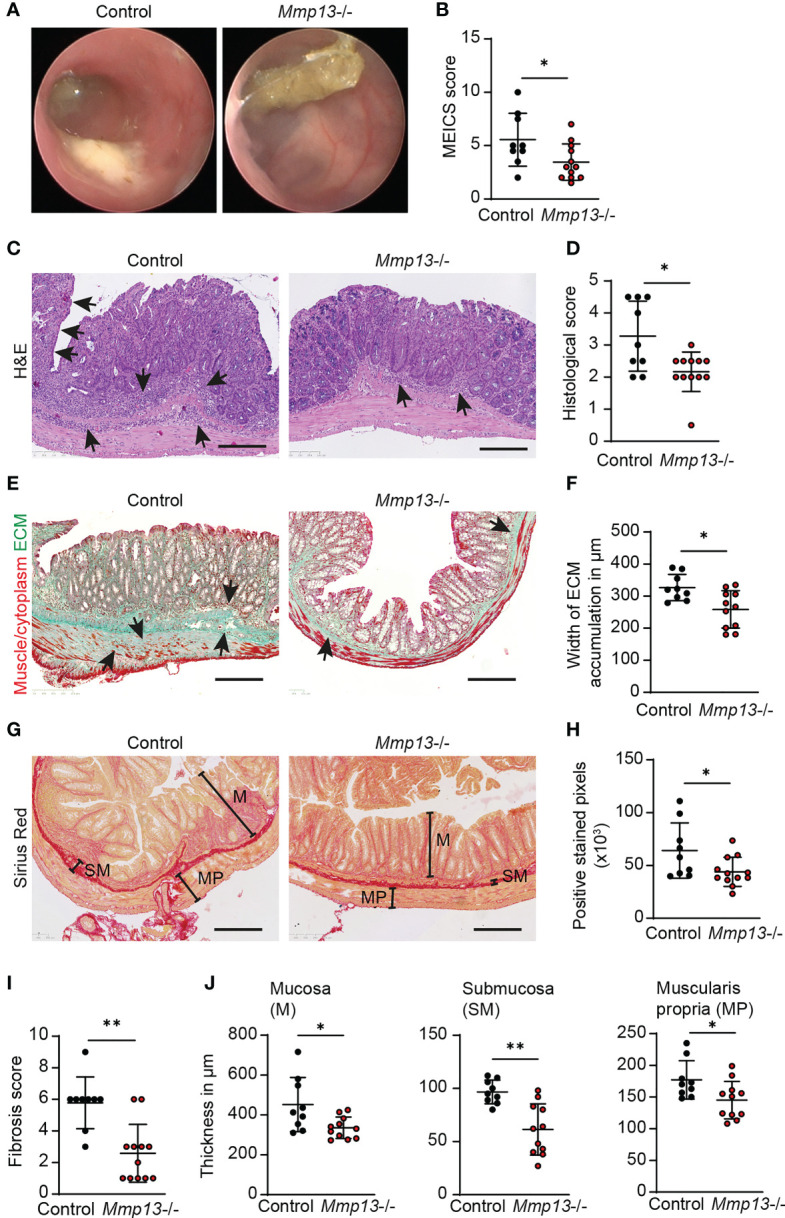
Mmp13 deficient mice show reduced fibrosis during experimental colitis. (A, B) Chronic DSS-induced colitis with 3 repeated cycles of DSS administration in the drinking water was performed with Mmp13-/- and heterozygous littermate controls. (A) Colonoscopy was performed at day 63 and (B) the murine endoscopic index of colitis severity (MEICS) was used to score the mucosal inflammation (n= 9-11 per group). (C, D) Distal colon sections from Mmp13-/- mice vs controls from chronic DSS colitis were used for H&E stainings. Histopathological scoring of H&E stained colon sections was performed at day 63. Arrows highlight immune cell infiltration and erosion of the IEC layer. (E, F) Sections of distal colon tissue from Mmp13-/- and controls from (A) was used for Masson’s trichrome staining. Arrows indicate the accumulation of extracellular matrix. The width of ECM accumulation reflects the thickness of the submucosa, muscularis mucosa and muscularis propria. (G, H) 3 repetitive cycles of DSS were administered to Mmp13-/- and littermate controls. Distal colon tissue of these mice was used for Sirius Red staining. Based on the Sirius Red stainings, the amount of ECM was quantified as positive stained pixels by Qupath. (I) The fibrosis scoring including the distribution of ECM within the colon wall as well as the percent involvement of the tissue was assessed from colon tissue of control vs. Mmp13-/- mice from chronic DSS colitis, that was stained with Sirius Red. (J) Colon tissue of Mmp13-/- mice and littermate controls, that was stained for Sirius Red, was used for measurement of the thickness of the mucosa (M) (maximal width), submucosa (SM), and muscularis propria (MP) as indicated in (G) Quantitative data were analyzed by with Wilcoxon-Mann-Whitney test (*p>0.05, **p>0.01, two-tailed) and mean values are shown with standard deviation. Scale bar represents 250µm.
