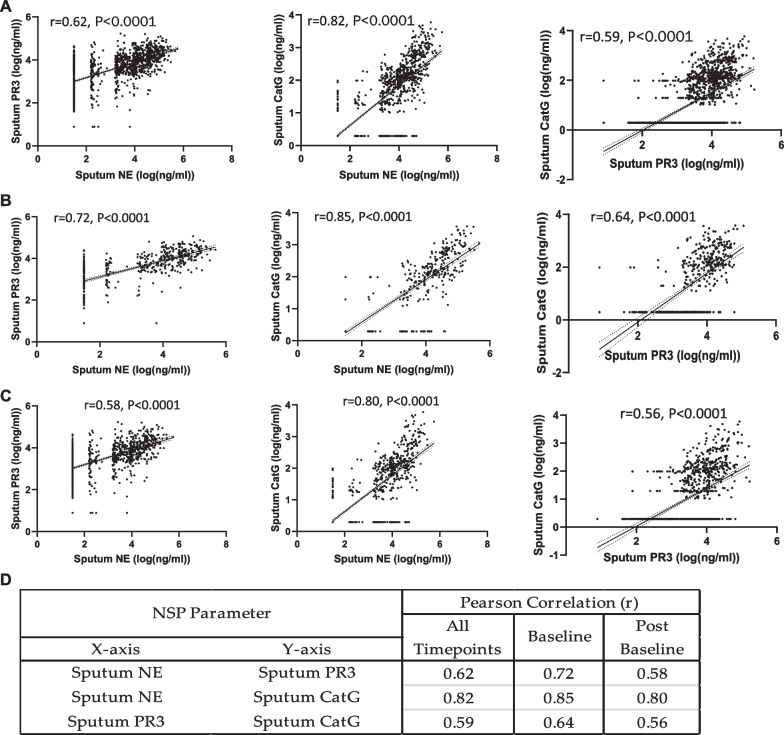
Fig. 3.
Correlation of sputum NSP activities from all treatment arms. Pearson correlation analysis within sputum NSPs at (a) all timepoints, (b) at baseline and (c) at only post-baseline time points. (d) Summaries of the Pearson correlation coefficients (r) between each sputum NSP activity from baseline values and from values at all timepoints. Simple linear regression was plotted with the best-fit line plus 95% confidence intervals. The total number of paired data points from baseline through week 28 are: NE and PR3 (n = 1073), NE and CatG (n = 1085) and PR3 and CatG (n = 1070)

