
FIGURE 1.
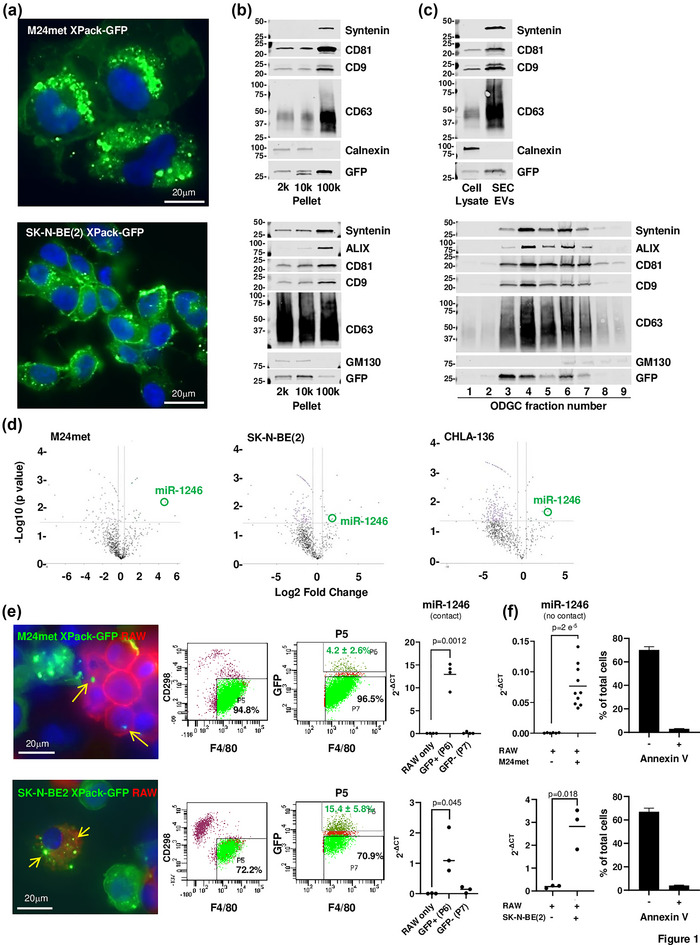
Engineered human melanoma and neuroblastoma cells release GFP‐tagged TEVs that are captured in vitro by mouse macrophages. (a) Immunofluorescence microscopy of M24met XPack‐GFP and SK‐N‐BE(2) XPack‐GFP cells showing GFP‐labelled vesicles (green). Nuclei are stained with DAPI (blue). (b) Cultures media were collected and TEVs were purified as indicated in materials and methods and illustrated in Figure S1a. Western blot was performed on pellets obtained by DUC for the indicated exosomal and non‐exosomal proteins. (c) Western blot analysis of TEVs isolated by SEC or ODGC fractions obtained from the 100K pellet. (d) TEVs from the culture medium of indicated cell lines and EVs from mouse myeloid cells were purified by SEC and ODGC, and total RNA was analysed by NanoString nCounter to determine the miR profile. Volcano plots of a Rosalind analysis show fold changes in miR expression in TEVs versus mouse EVs (x axis) and the p values (y axis). (e) Fluorescent microscopic images of M24met XPack‐GFP and SK‐N‐BE(2) XPack‐GFP cells co‐cultured with mouse RAW 264.7 macrophages stained with an anti‐F4/80 antibody (left). Flow cytometry acquisition plots during sorting of F4/80+ RAW 264.7 cells from CD298+ cancer cells (middle). RT‐PCR analysis for miR‐1246 presence in RNA isolated from sorted F4/80+ GFP+ (P6) and F4/80+ GFP‐ (P7) RAW 264.7 cells compared to RAW 264.7 cells cultured alone (right). Each point represents the average of technical triplicates of an experiment done with three or four biological replicates and the graph is representative of an experiment repeated four times. (f) RT‐PCR analysis on RNA isolated from RAW 264.7 cells co‐cultured three to seven days in Transwell with M24met XPack‐GFP or SK‐N‐BE(2) XPack‐GFP showing the presence of TEV‐derived miR‐1246. Each point represents the average of technical triplicates of an experiment done with three or four biological replicates. The top graph represents the combined results of three separate experiments and the bottom graph is representative of an experiment repeated three times (left). Percentage of apoptotic and non‐apoptotic cancer cells after a three‐day co‐culture with RAW 264.7 cells (right).